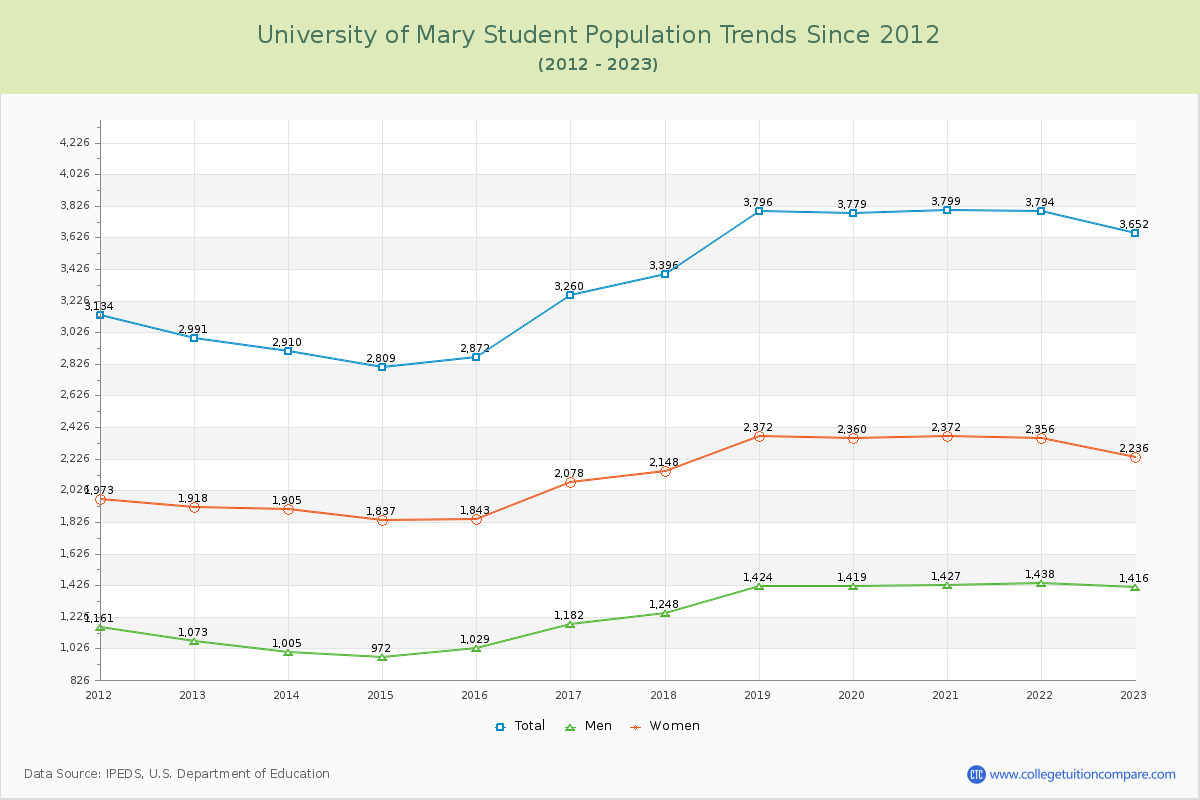
Student Population Changes
The average student population over the last 12 years is 3,369 where 3,652 students are attending the school for the academic year 2022-2023.
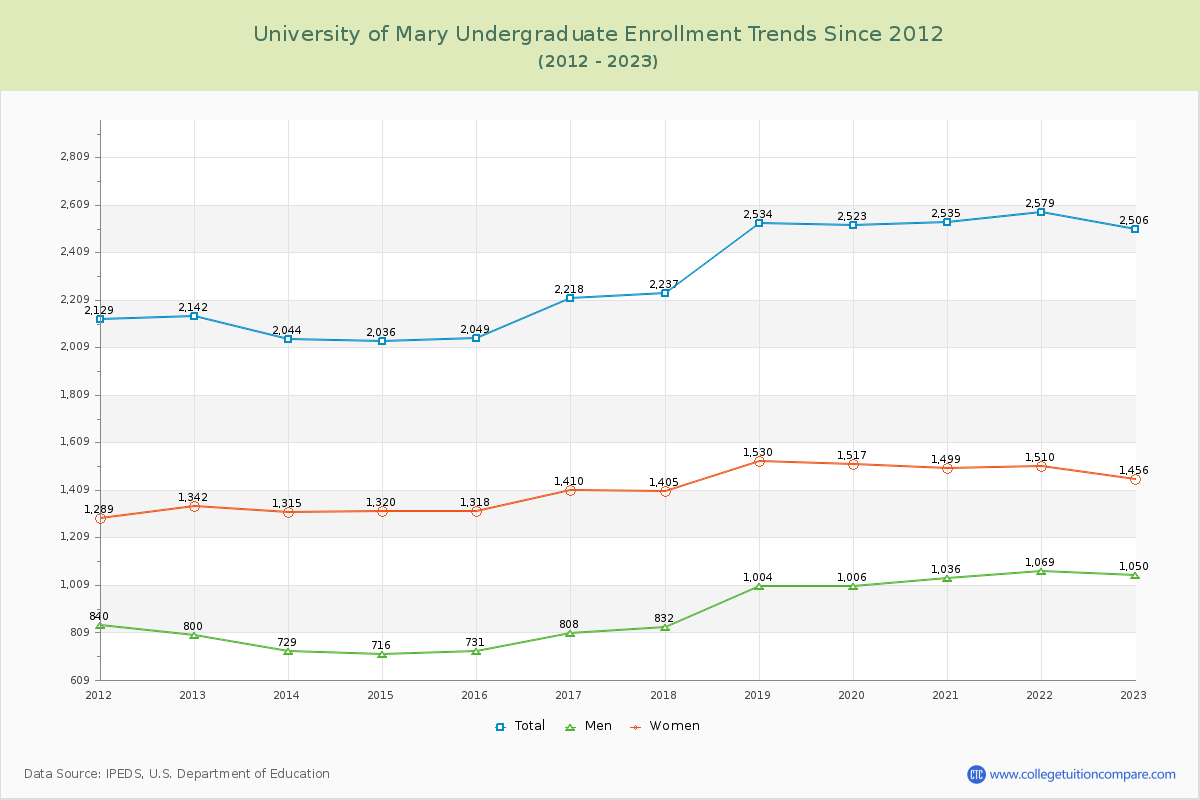
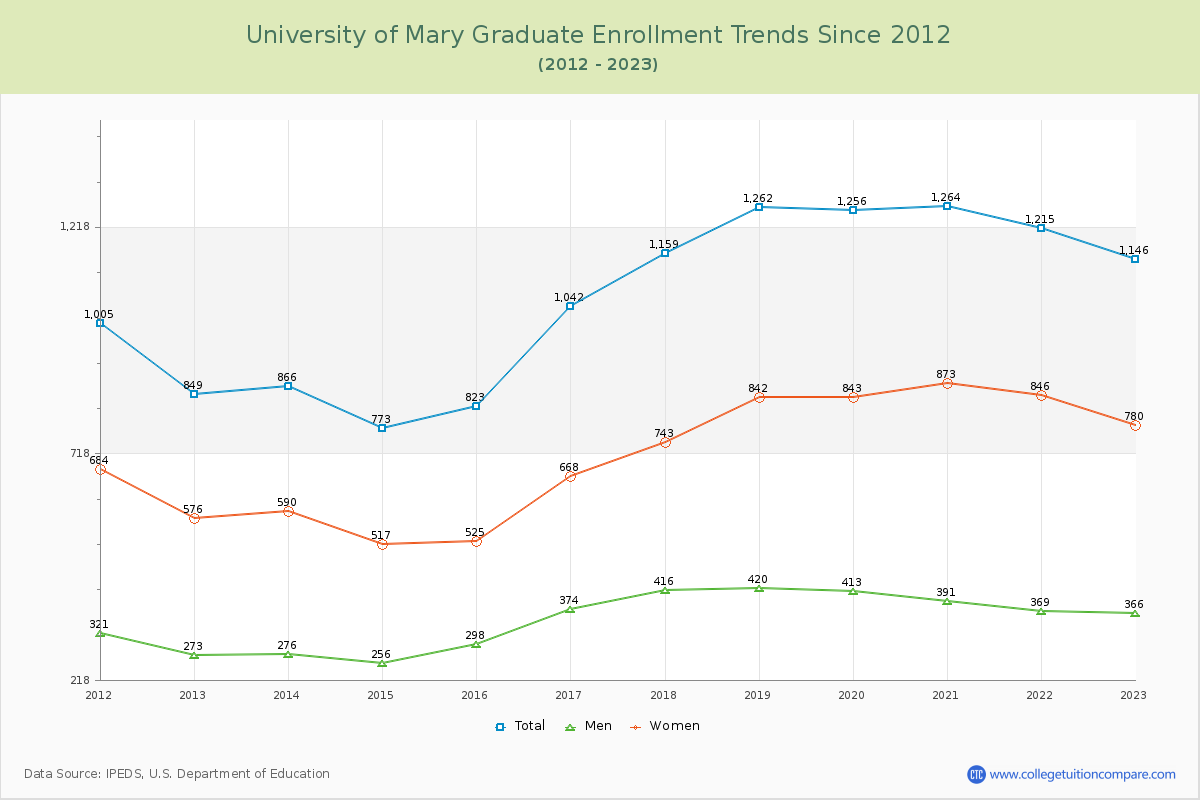
68.62% of total students is undergraduate students and 31.38% students is graduate students. The number of undergraduate students has increased by 364 and the graduate enrollment has increased by 297 over past 10 years.
The female to male ratio is 1.58 to 1 and it means that there are more female students enrolled in UMary than male students.
The following table and chart illustrate the changes in student population by gender at University of Mary since 2012.
| Year | Total | Undergraduate | Graduate | ||||
|---|---|---|---|---|---|---|---|
| Total | Men | Women | Total | Men | Women | ||
| 2012-13 | 2,991 | 2,142 | 800 | 1,342 | 849 | 273 | 576 |
| 2013-14 | 2,910 -81 | 2,044 -98 | 729 -71 | 1,315 -27 | 866 17 | 276 3 | 590 14 |
| 2014-15 | 2,809 -101 | 2,036 -8 | 716 -13 | 1,320 5 | 773 -93 | 256 -20 | 517 -73 |
| 2015-16 | 2,872 63 | 2,049 13 | 731 15 | 1,318 -2 | 823 50 | 298 42 | 525 8 |
| 2016-17 | 3,260 388 | 2,218 169 | 808 77 | 1,410 92 | 1,042 219 | 374 76 | 668 143 |
| 2017-18 | 3,396 136 | 2,237 19 | 832 24 | 1,405 -5 | 1,159 117 | 416 42 | 743 75 |
| 2018-19 | 3,796 400 | 2,534 297 | 1,004 172 | 1,530 125 | 1,262 103 | 420 4 | 842 99 |
| 2019-20 | 3,779 -17 | 2,523 -11 | 1,006 2 | 1,517 -13 | 1,256 -6 | 413 -7 | 843 1 |
| 2020-21 | 3,799 20 | 2,535 12 | 1,036 30 | 1,499 -18 | 1,264 8 | 391 -22 | 873 30 |
| 2021-22 | 3,794 -5 | 2,579 44 | 1,069 33 | 1,510 11 | 1,215 -49 | 369 -22 | 846 -27 |
| 2022-23 | 3,652 -142 | 2,506 -73 | 1,050 -19 | 1,456 -54 | 1,146 -69 | 366 -3 | 780 -66 |
| Average | 3,369 | 2,309 | 889 | 1,420 | 1,060 | 350 | 709 |