Enrollment Trends at UMFK

3

Total Enrollment

-16

Men

19

Women

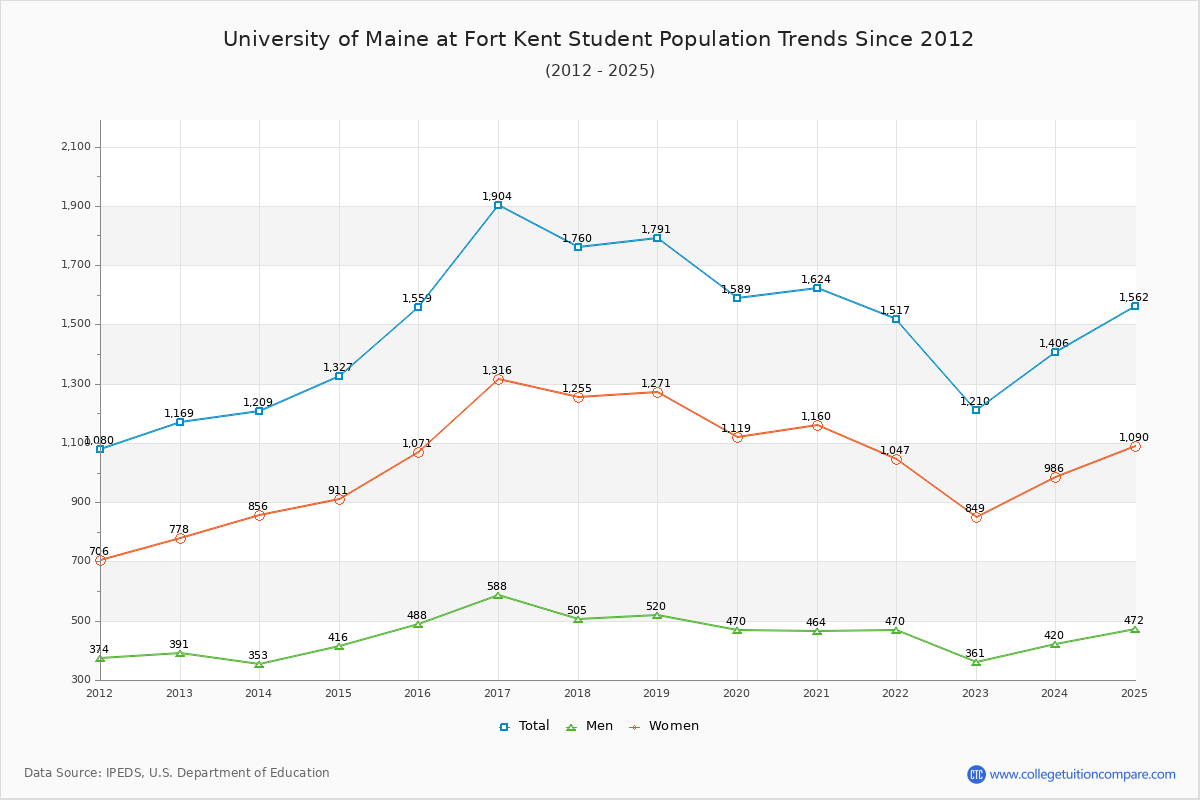
The student population at University of Maine at Fort Kent is 1,562 (1,464 undergraduate and 98 graduate students) . The number of students has increased by 3 over the past decade.

The percentage of undergraduate students at UMFK is 93.73% which is decreased by 95 over last 10 years. The graduate student population increased by 98 and it has been increasing.

The female to male ratio is 2.31 to 1 which means that majority of population is on female students.

591 students enrolled in online degree program exclusively and the number of online students has increased by 17.73% since 2015.

Student Population Changes

The average student population over the last 11 years is 1,592 where 1,562 students are attending the school for the academic year 2024-2025.

93.73% of total students is undergraduate students and 6.27% students is graduate students. The number of undergraduate students has decreased by 95 and the graduate enrollment has increased by 98 over past 10 years.

The female to male ratio is 2.31 to 1 and it means that there are far more female students enrolled in UMFK than male students.

The following table and chart illustrate the changes in student population by gender at University of Maine at Fort Kent since 2015.

YearTotalUndergraduateGraduate
TotalMenWomenTotalMenWomen
2015-161,5591,5594881,071000
2016-171,904
345
1,904
345
588
100
1,316
245
000
2017-181,760
-144
1,760
-144
505
-83
1,255
-61
000
2018-191,791
31
1,791
31
520
15
1,271
16
000
2019-201,589
-202
1,589
-202
470
-50
1,119
-152
000
2020-211,624
35
1,624
35
464
-6
1,160
41
000
2021-221,517
-107
1,517
-107
470
6
1,047
-113
000
2022-231,210
-307
1,194
-323
358
-112
836
-211
16
16
3
3
13
13
2023-241,406
196
1,357
163
414
56
943
107
49
33
6
3
43
30
2024-251,562
156
1,464
107
456
42
1,008
65
98
49
16
10
82
39
Average1,5921,5764731,10316314
University of Maine at Fort Kent Enrollment Trends Chart

Undergraduate Enrollment Changes

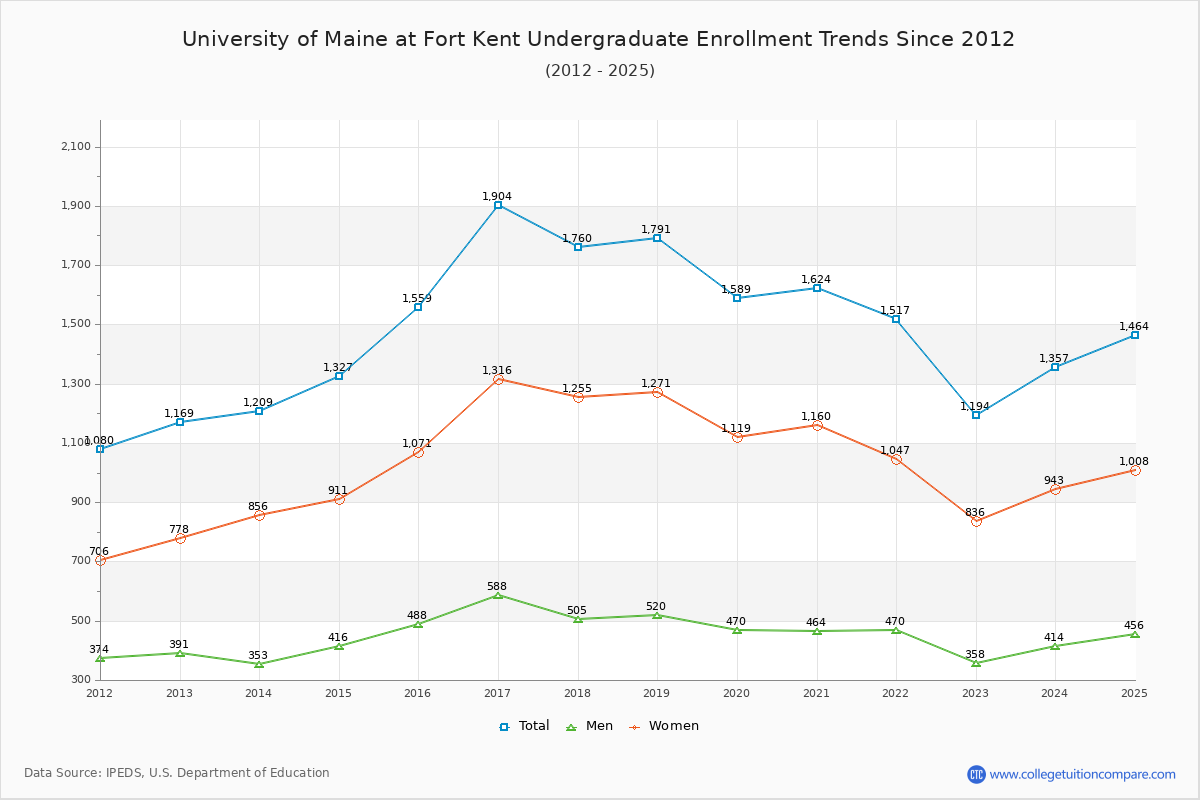
The average number of Undergraduate students over the last 11 years is 1,576 where 1,464 students are attending the Undergraduate school for the academic year 2024-2025. The following table and chart illustrate the changes in Undergraduate enrollment by attending status and gender at University of Maine at Fort Kent since 2015.

YearTotalFull-timePart-time
TotalMenWomenTotalMenWomen
2015-161,559583205378976283693
2016-171,9046682104581,236378858
2017-181,7605822023801,178303875
2018-191,7915812083731,210312898
2019-201,5895521883641,037282755
2020-211,6245261743521,098290808
2021-221,5174431502931,074320754
2022-231,194337113224857245612
2023-241,3573341162181,023298725
2024-251,4643321132191,132343789
Average1,5761,5761683261,576305777
University of Maine at Fort Kent Undergraduate Enrollment Trends Chart

Graduate Enrollment Changes

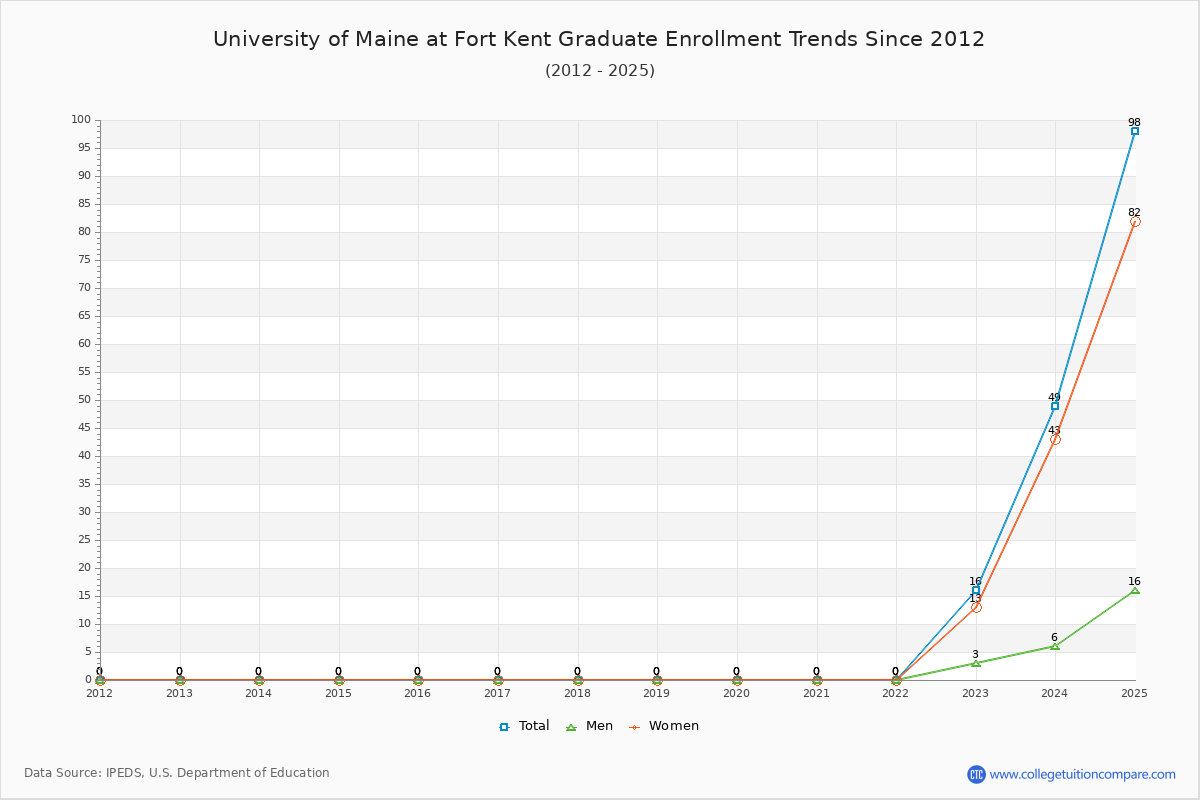
The average number of Graduate students over the last 11 years is 16 where 98 students are attending the Graduate school for the academic year 2024-2025. The following table and chart illustrate the changes in Graduate enrollment by attending status and gender at University of Maine at Fort Kent since 2015.

YearTotalFull-timePart-time
TotalMenWomenTotalMenWomen
2015-160000000
2016-170000000
2017-180000000
2018-190000000
2019-200000000
2020-210000000
2021-220000000
2022-231614113220
2023-244980841635
2024-259815015831667
Average16160416210
University of Maine at Fort Kent Graduate Enrollment Trends Chart

Enrollment by Race/Ethnicity Changes

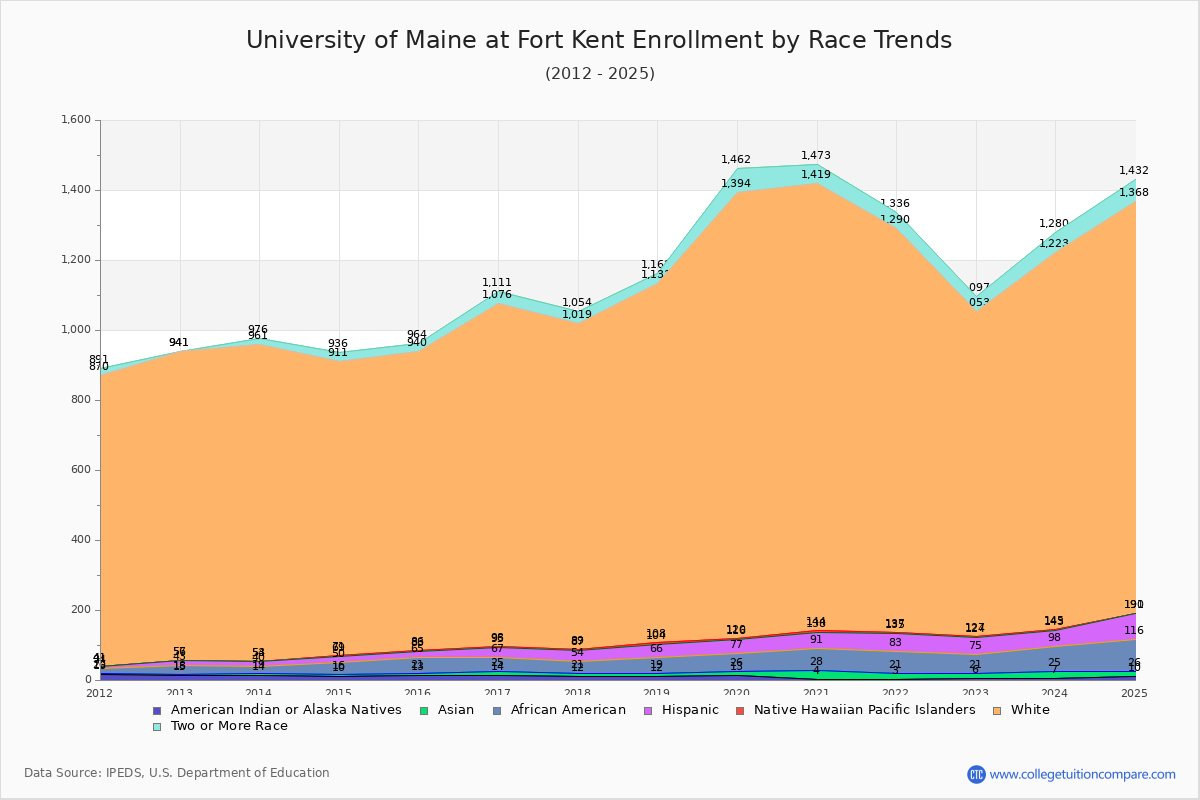
The percentage of white students is 75.35%. The percentage was 54.78% 10 years ago and UMFK still has a high percentage of white students. 1.02% of enrolled students is Asian and 5.76% is black students. Hispanic students comprise 4.74% of the student body.

Over the past 10 years, the racial composition has shifted. The percentage of white students increased from 54.78% to 75.35%. Asian enrollment grew from 0.51% to 1.02%. Black student enrollment increased from 2.82% to 5.76%. Hispanic student representation expanded from 1.15% to 4.74%.

The overall racial diversity, measured by the Census Bureau Diversity Index, is 0.4248 which indicates that somewhat diverse. This decreased from 0.6987 a decade ago, suggesting that racial diversity has declined.

The following table and chart illustrate the student population trends by race/ethnicity at University of Maine at Fort Kent over the past 11 years (2015-2025).

YearAmerican Indian or Native AmericanAsianBlackHispanicNative Hawaiian or Other Pacific IslanderWhiteTwo or More Races
2015-161384418385424
2016-1714114228397835
2017-181293333293035
2018-19127473841,02529
2019-201313513941,27468
2020-21424634761,27554
2021-22318625221,15346
2022-236155449392644
2023-24718734521,07857
2024-251016907411,17764
Average914564231,06746
University of Maine at Fort Kent Enrollment by Race Trends Chart

Distance Learning (Online Courses) Enrollment Changes

591 students are enrolled in online degree programs exclusively for the academic year 2024-2025, which is 38% of total students. The number of online students has increased 17.73% since 2015. The following table and chart illustrate the changes in the online student population by enrolled type at University of Maine at Fort Kent from 2015 to 2025.

YearTotal EnrollmentOnline CompletelyEnrolled in Some Online CoursesNot Enrolled in Online Courses
2015-161,559502453604
2016-171,904536497871
2017-181,760499478783
2018-191,7912264881,077
2019-201,589473421695
2020-211,624678438508
2021-221,517594364559
2022-231,210487294429
2023-241,406555595256
2024-251,562591292679
Average1,592514432646

Ratings & Review

Share your experiences and thoughts about University of Maine at Fort Kent. It will be a great help to applicants and prospective students!