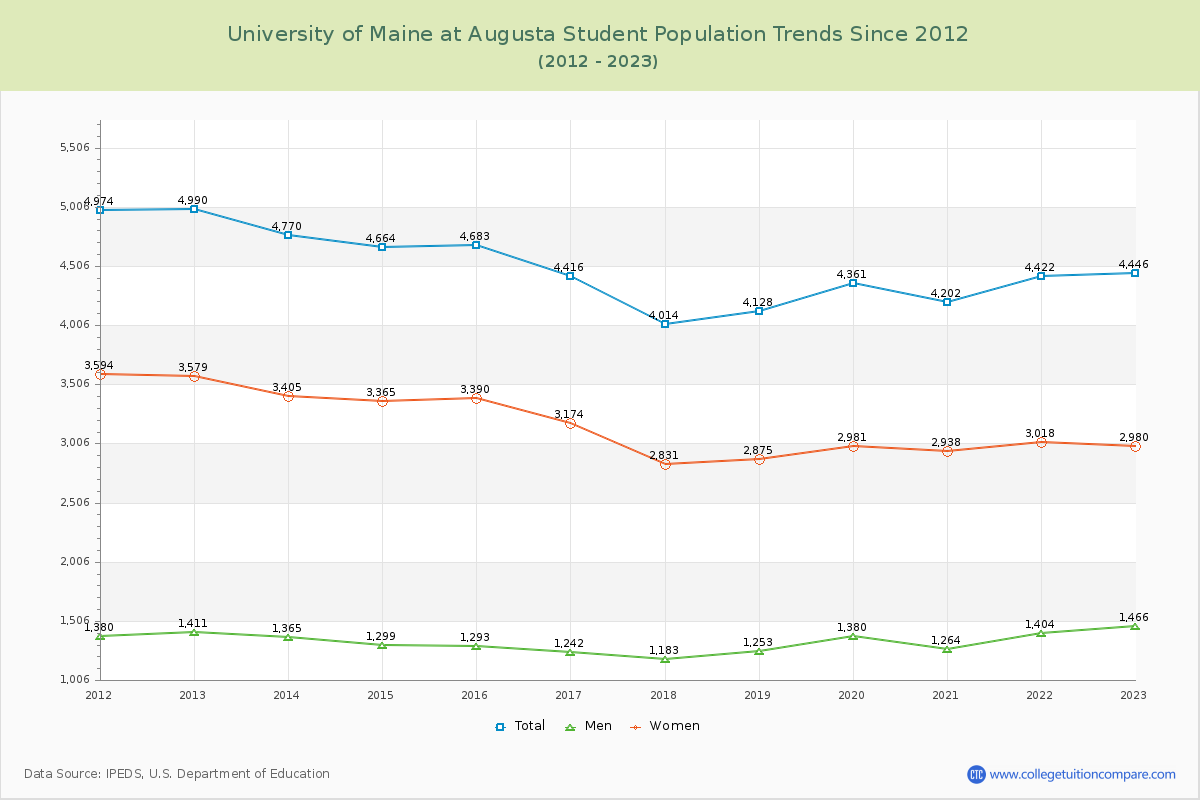
Student Population Changes
The average student population over the last 12 years is 4,463 where 4,446 students are attending the school for the academic year 2022-2023.
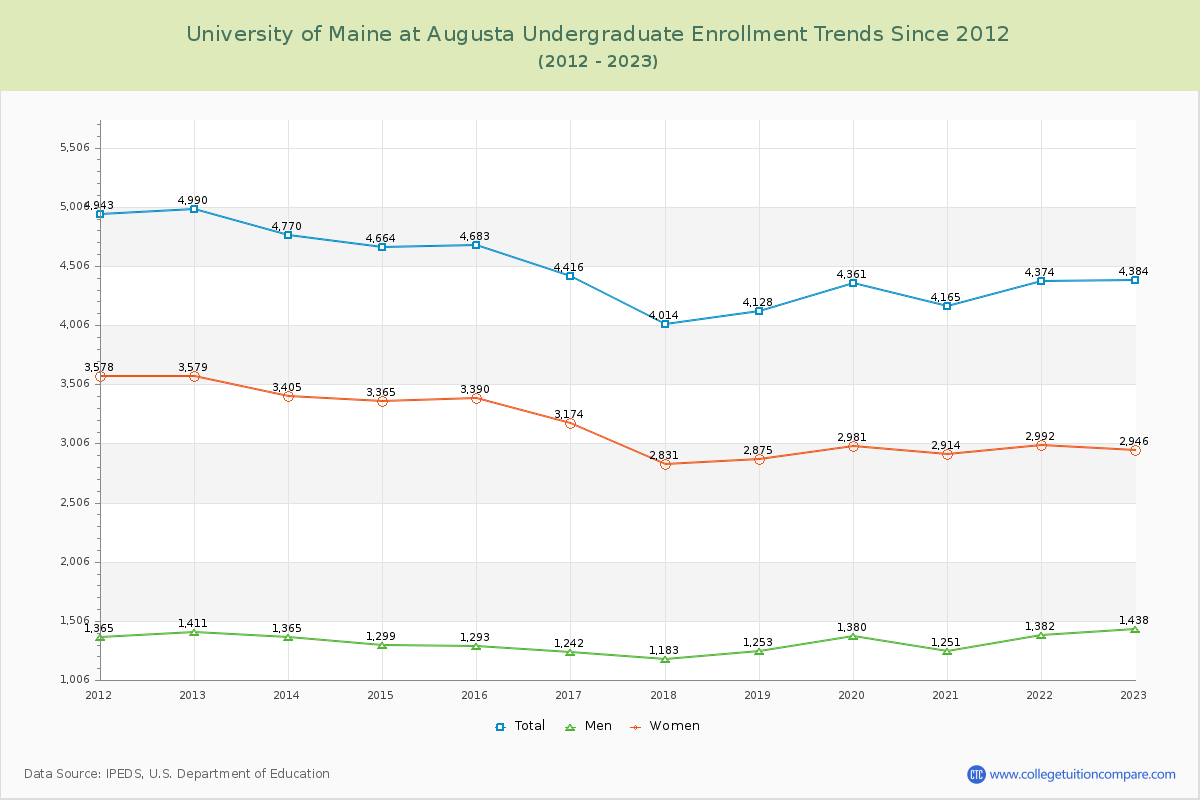
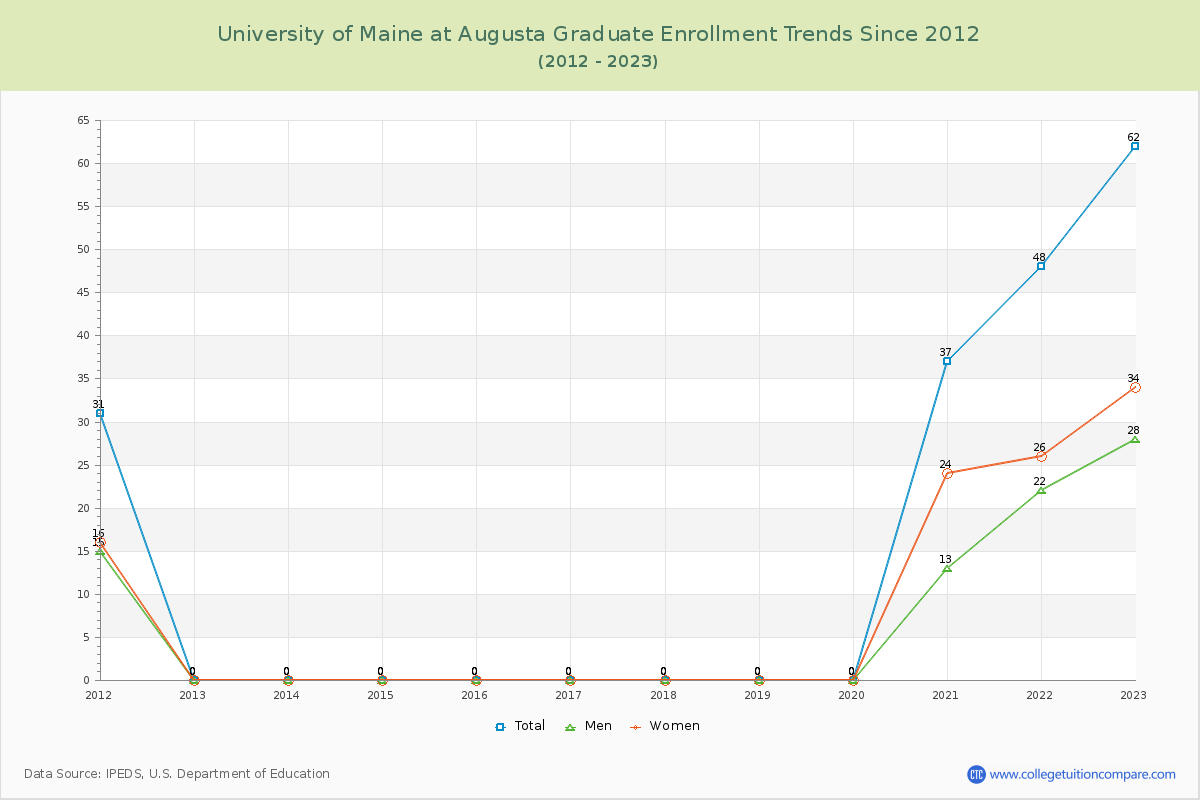
98.61% of total students is undergraduate students and 1.39% students is graduate students. The number of undergraduate students has decreased by 606 and the graduate enrollment has increased by 62 over past 10 years.
The female to male ratio is 2.03 to 1 and it means that there are far more female students enrolled in UMA than male students.
The following table and chart illustrate the changes in student population by gender at University of Maine at Augusta since 2012.
| Year | Total | Undergraduate | Graduate | ||||
|---|---|---|---|---|---|---|---|
| Total | Men | Women | Total | Men | Women | ||
| 2012-13 | 4,990 | 4,990 | 1,411 | 3,579 | 0 | 0 | 0 |
| 2013-14 | 4,770 -220 | 4,770 -220 | 1,365 -46 | 3,405 -174 | 0 0 | 0 0 | 0 0 |
| 2014-15 | 4,664 -106 | 4,664 -106 | 1,299 -66 | 3,365 -40 | 0 0 | 0 0 | 0 0 |
| 2015-16 | 4,683 19 | 4,683 19 | 1,293 -6 | 3,390 25 | 0 0 | 0 0 | 0 0 |
| 2016-17 | 4,416 -267 | 4,416 -267 | 1,242 -51 | 3,174 -216 | 0 0 | 0 0 | 0 0 |
| 2017-18 | 4,014 -402 | 4,014 -402 | 1,183 -59 | 2,831 -343 | 0 0 | 0 0 | 0 0 |
| 2018-19 | 4,128 114 | 4,128 114 | 1,253 70 | 2,875 44 | 0 0 | 0 0 | 0 0 |
| 2019-20 | 4,361 233 | 4,361 233 | 1,380 127 | 2,981 106 | 0 0 | 0 0 | 0 0 |
| 2020-21 | 4,202 -159 | 4,165 -196 | 1,251 -129 | 2,914 -67 | 37 37 | 13 13 | 24 24 |
| 2021-22 | 4,422 220 | 4,374 209 | 1,382 131 | 2,992 78 | 48 11 | 22 9 | 26 2 |
| 2022-23 | 4,446 24 | 4,384 10 | 1,438 56 | 2,946 -46 | 62 14 | 28 6 | 34 8 |
| Average | 4,463 | 4,450 | 1,318 | 3,132 | 13 | 6 | 8 |