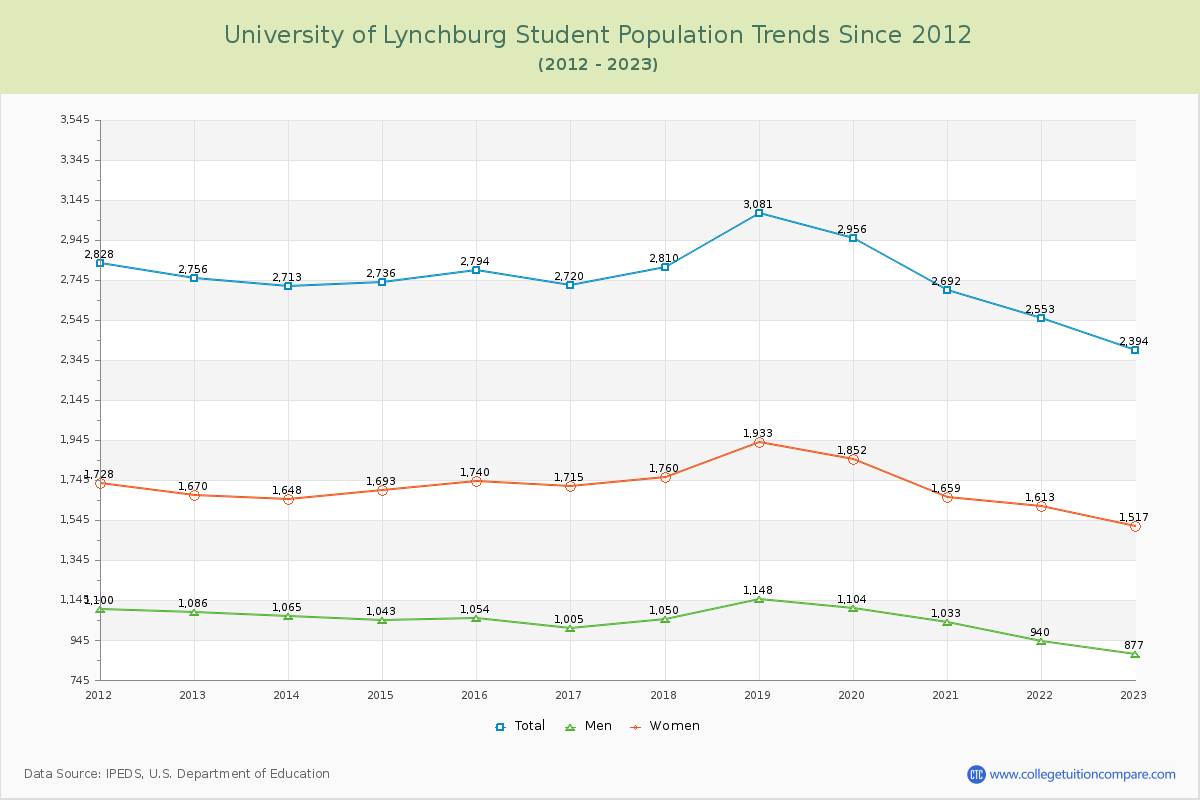
Student Population Changes
The average student population over the last 12 years is 2,746 where 2,394 students are attending the school for the academic year 2022-2023.
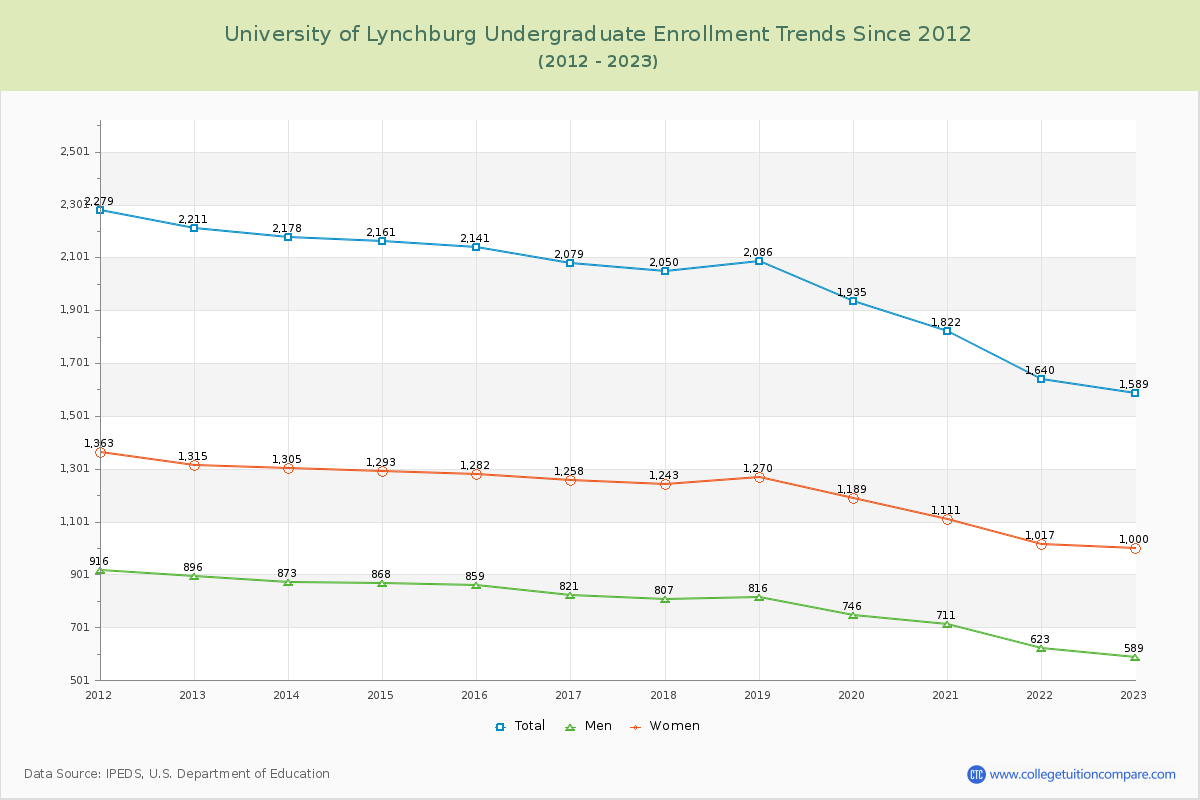
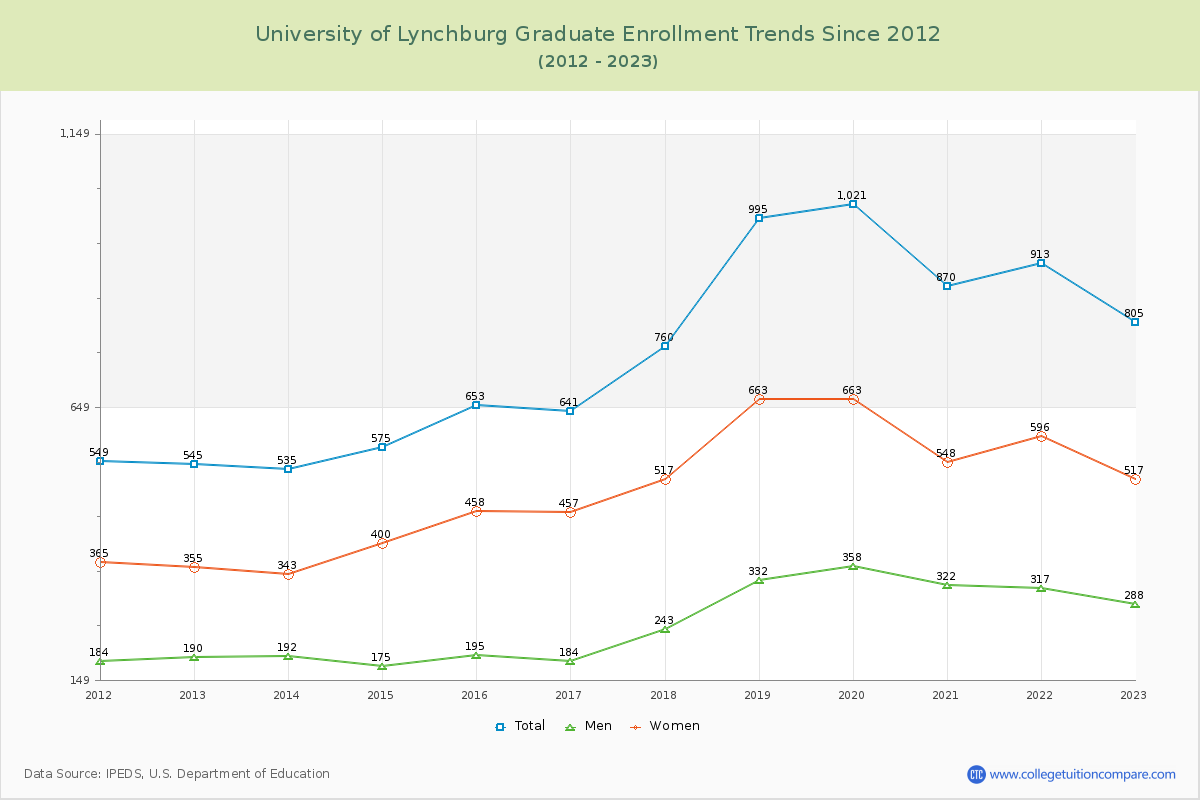
66.37% of total students is undergraduate students and 33.63% students is graduate students. The number of undergraduate students has decreased by 622 and the graduate enrollment has increased by 260 over past 10 years.
The female to male ratio is 1.73 to 1 and it means that there are more female students enrolled in U of Lynchburg than male students.
The following table and chart illustrate the changes in student population by gender at University of Lynchburg since 2012.
| Year | Total | Undergraduate | Graduate | ||||
|---|---|---|---|---|---|---|---|
| Total | Men | Women | Total | Men | Women | ||
| 2012-13 | 2,756 | 2,211 | 896 | 1,315 | 545 | 190 | 355 |
| 2013-14 | 2,713 -43 | 2,178 -33 | 873 -23 | 1,305 -10 | 535 -10 | 192 2 | 343 -12 |
| 2014-15 | 2,736 23 | 2,161 -17 | 868 -5 | 1,293 -12 | 575 40 | 175 -17 | 400 57 |
| 2015-16 | 2,794 58 | 2,141 -20 | 859 -9 | 1,282 -11 | 653 78 | 195 20 | 458 58 |
| 2016-17 | 2,720 -74 | 2,079 -62 | 821 -38 | 1,258 -24 | 641 -12 | 184 -11 | 457 -1 |
| 2017-18 | 2,810 90 | 2,050 -29 | 807 -14 | 1,243 -15 | 760 119 | 243 59 | 517 60 |
| 2018-19 | 3,081 271 | 2,086 36 | 816 9 | 1,270 27 | 995 235 | 332 89 | 663 146 |
| 2019-20 | 2,956 -125 | 1,935 -151 | 746 -70 | 1,189 -81 | 1,021 26 | 358 26 | 663 0 |
| 2020-21 | 2,692 -264 | 1,822 -113 | 711 -35 | 1,111 -78 | 870 -151 | 322 -36 | 548 -115 |
| 2021-22 | 2,553 -139 | 1,640 -182 | 623 -88 | 1,017 -94 | 913 43 | 317 -5 | 596 48 |
| 2022-23 | 2,394 -159 | 1,589 -51 | 589 -34 | 1,000 -17 | 805 -108 | 288 -29 | 517 -79 |
| Average | 2,746 | 1,990 | 783 | 1,208 | 756 | 254 | 502 |