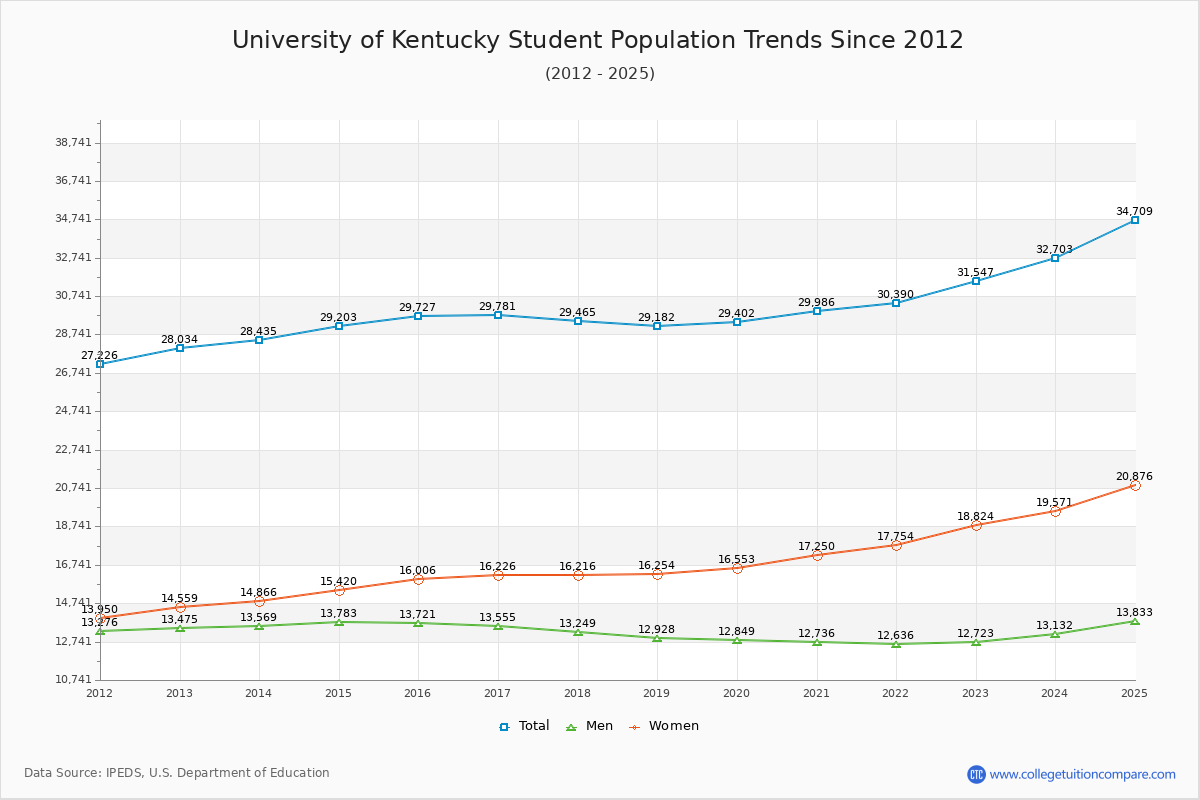
Student Population Changes
The average student population over the last 12 years is 29,559 where 31,547 students are attending the school for the academic year 2022-2023.
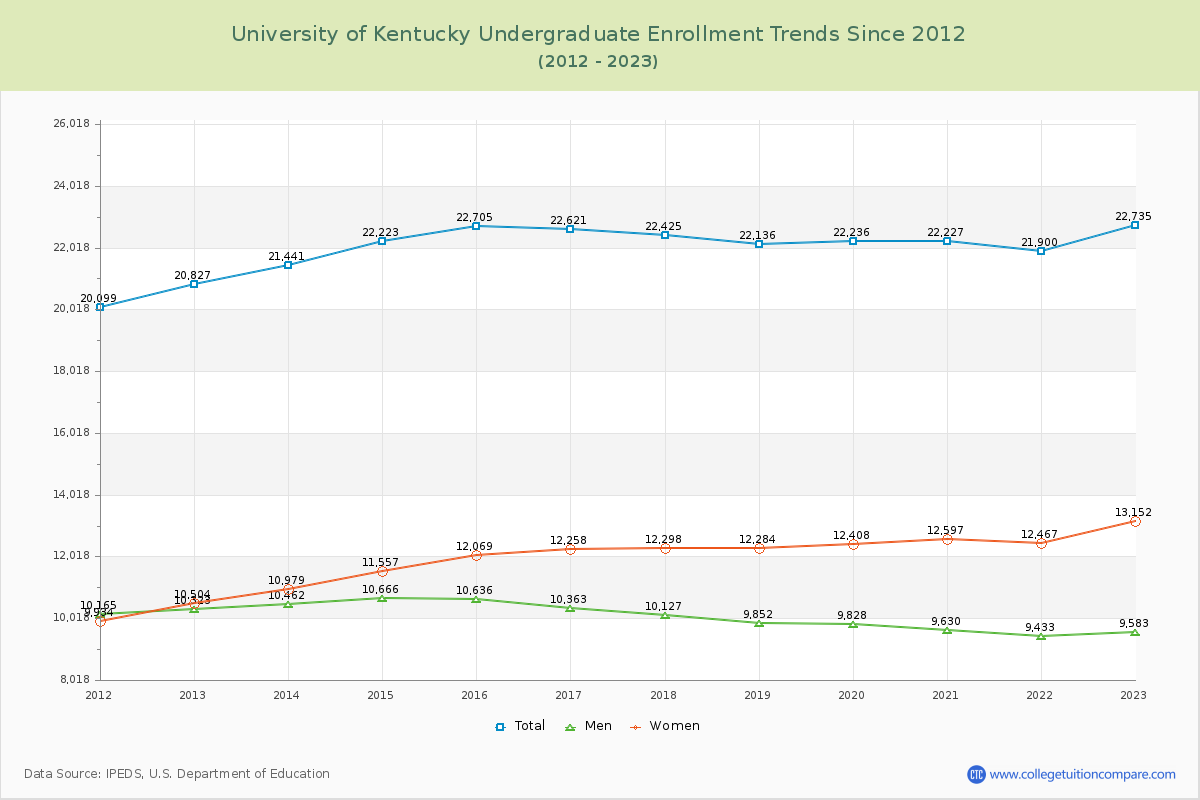
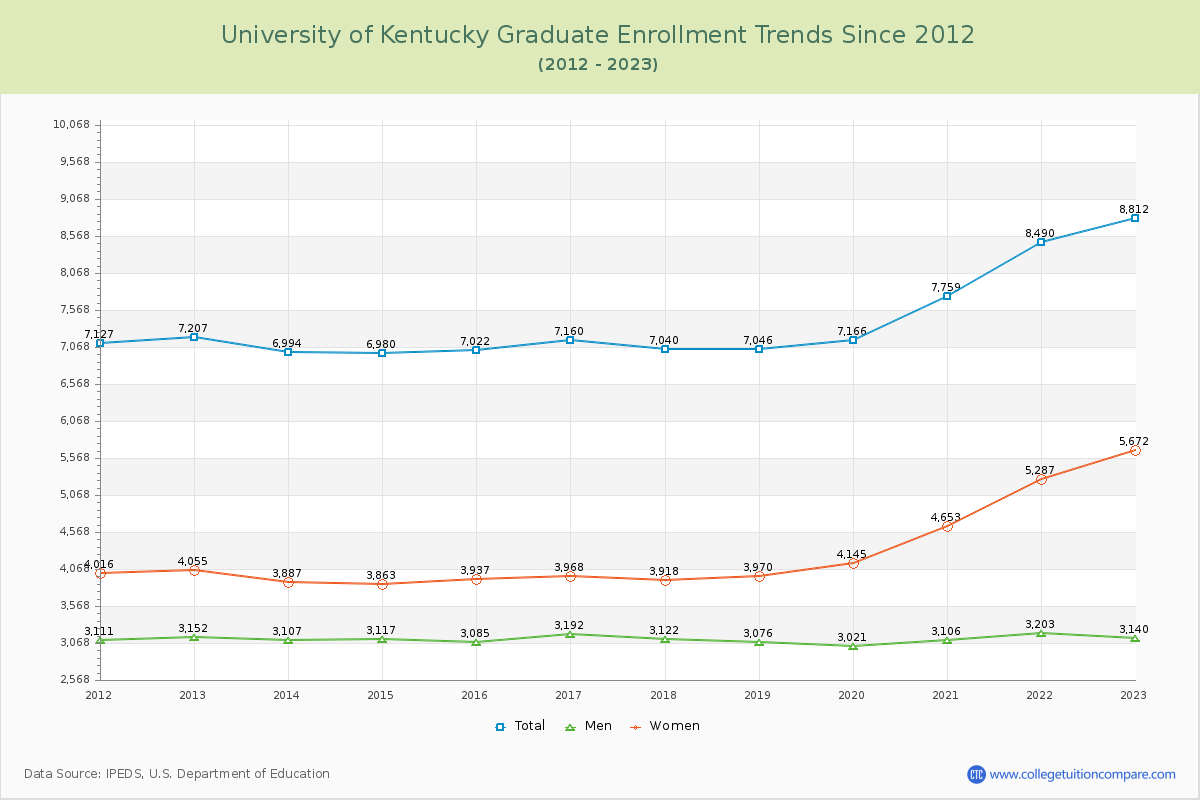
72.07% of total students is undergraduate students and 27.93% students is graduate students. The number of undergraduate students has increased by 1,908 and the graduate enrollment has increased by 1,605 over past 10 years.
The female to male ratio is 1.48 to 1 and it means that there are more female students enrolled in U of Kentucky than male students.
The following table and chart illustrate the changes in student population by gender at University of Kentucky since 2012.
| Year | Total | Undergraduate | Graduate | ||||
|---|---|---|---|---|---|---|---|
| Total | Men | Women | Total | Men | Women | ||
| 2012-13 | 28,034 | 20,827 | 10,323 | 10,504 | 7,207 | 3,152 | 4,055 |
| 2013-14 | 28,435 401 | 21,441 614 | 10,462 139 | 10,979 475 | 6,994 -213 | 3,107 -45 | 3,887 -168 |
| 2014-15 | 29,203 768 | 22,223 782 | 10,666 204 | 11,557 578 | 6,980 -14 | 3,117 10 | 3,863 -24 |
| 2015-16 | 29,727 524 | 22,705 482 | 10,636 -30 | 12,069 512 | 7,022 42 | 3,085 -32 | 3,937 74 |
| 2016-17 | 29,781 54 | 22,621 -84 | 10,363 -273 | 12,258 189 | 7,160 138 | 3,192 107 | 3,968 31 |
| 2017-18 | 29,465 -316 | 22,425 -196 | 10,127 -236 | 12,298 40 | 7,040 -120 | 3,122 -70 | 3,918 -50 |
| 2018-19 | 29,182 -283 | 22,136 -289 | 9,852 -275 | 12,284 -14 | 7,046 6 | 3,076 -46 | 3,970 52 |
| 2019-20 | 29,402 220 | 22,236 100 | 9,828 -24 | 12,408 124 | 7,166 120 | 3,021 -55 | 4,145 175 |
| 2020-21 | 29,986 584 | 22,227 -9 | 9,630 -198 | 12,597 189 | 7,759 593 | 3,106 85 | 4,653 508 |
| 2021-22 | 30,390 404 | 21,900 -327 | 9,433 -197 | 12,467 -130 | 8,490 731 | 3,203 97 | 5,287 634 |
| 2022-23 | 31,547 1,157 | 22,735 835 | 9,583 150 | 13,152 685 | 8,812 322 | 3,140 -63 | 5,672 385 |
| Average | 29,559 | 22,134 | 10,082 | 12,052 | 7,425 | 3,120 | 4,305 |