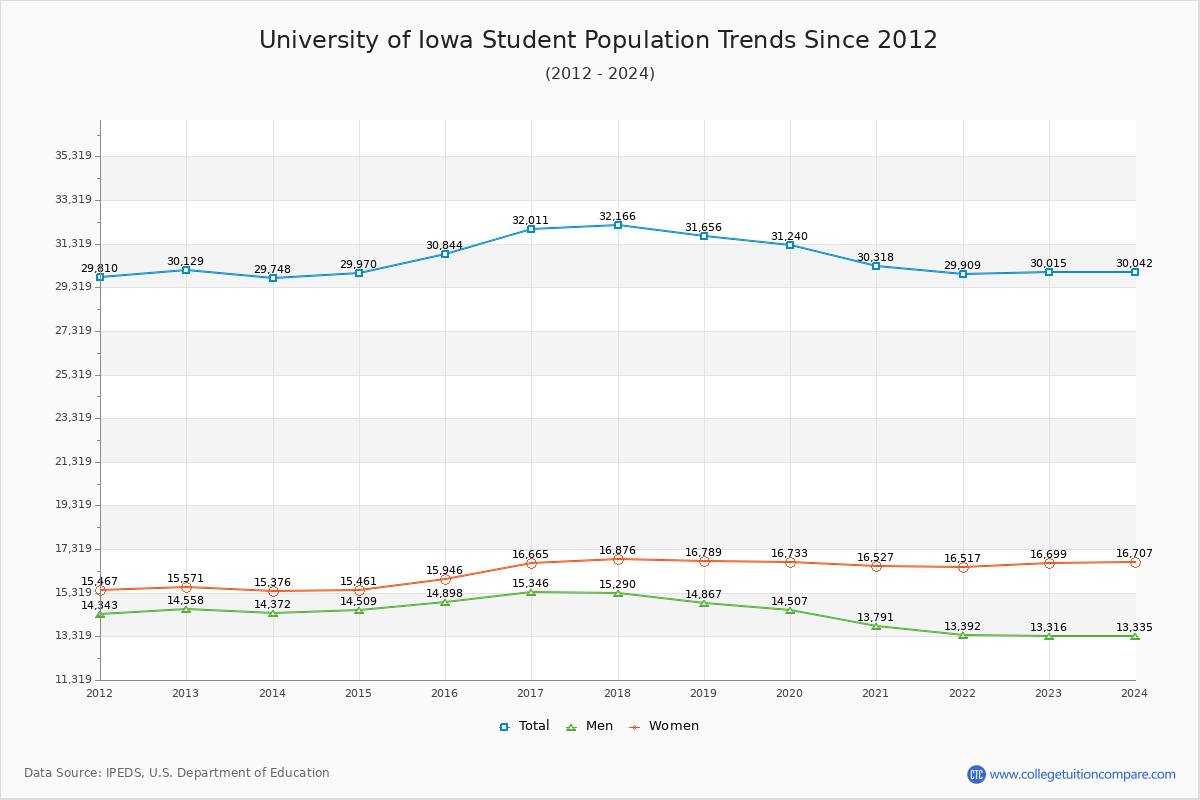
Student Population Changes
The average student population over the last 12 years is 30,728 where 30,015 students are attending the school for the academic year 2022-2023.
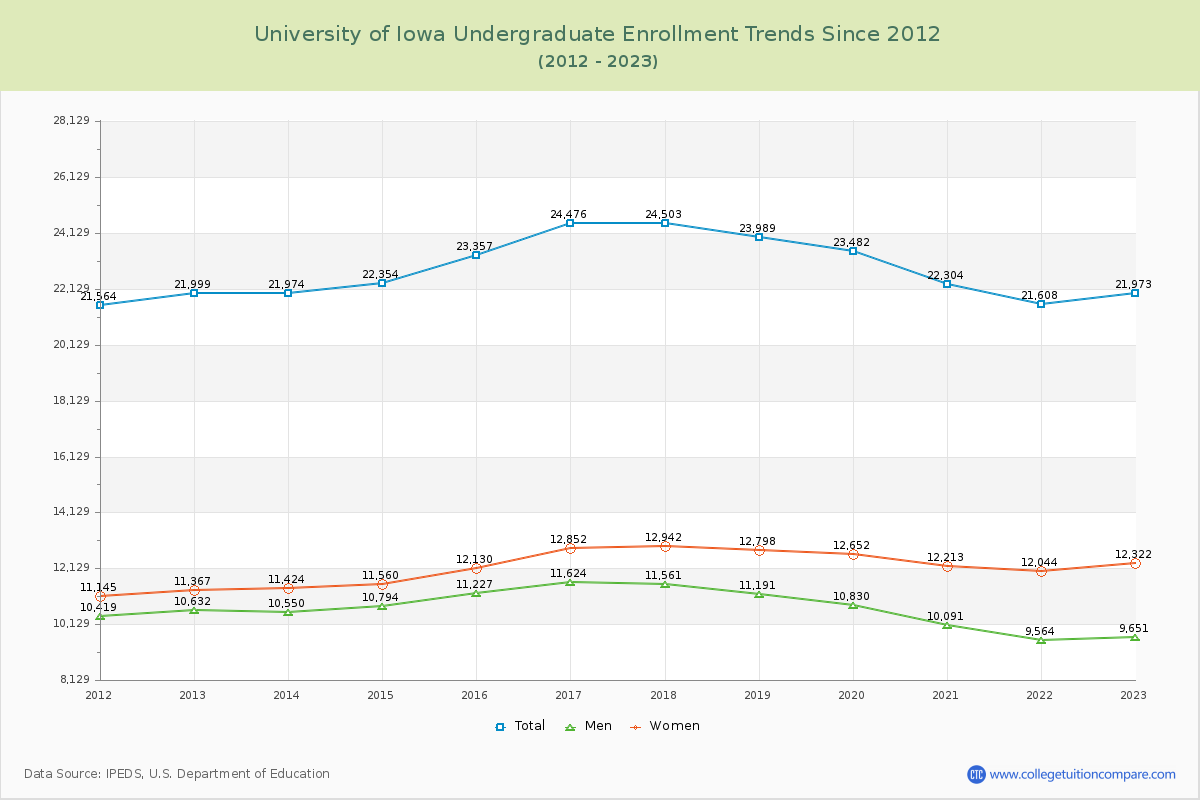
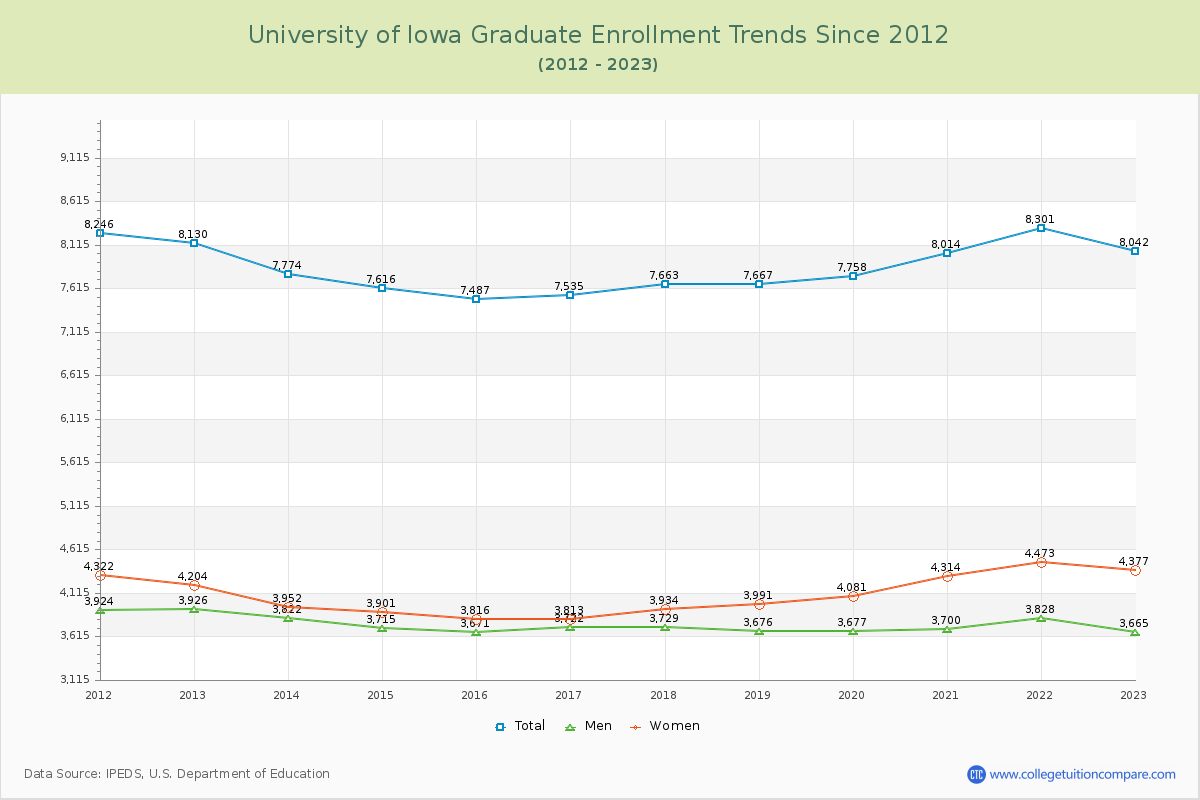
73.21% of total students is undergraduate students and 26.79% students is graduate students. The number of undergraduate students has decreased by 26 and the graduate enrollment has decreased by 88 over past 10 years.
The female to male ratio is 1.25 to 1 and it means that there are slightly more female students enrolled in UI than male students.
The following table and chart illustrate the changes in student population by gender at University of Iowa since 2012.
| Year | Total | Undergraduate | Graduate | ||||
|---|---|---|---|---|---|---|---|
| Total | Men | Women | Total | Men | Women | ||
| 2012-13 | 30,129 | 21,999 | 10,632 | 11,367 | 8,130 | 3,926 | 4,204 |
| 2013-14 | 29,748 -381 | 21,974 -25 | 10,550 -82 | 11,424 57 | 7,774 -356 | 3,822 -104 | 3,952 -252 |
| 2014-15 | 29,970 222 | 22,354 380 | 10,794 244 | 11,560 136 | 7,616 -158 | 3,715 -107 | 3,901 -51 |
| 2015-16 | 30,844 874 | 23,357 1,003 | 11,227 433 | 12,130 570 | 7,487 -129 | 3,671 -44 | 3,816 -85 |
| 2016-17 | 32,011 1,167 | 24,476 1,119 | 11,624 397 | 12,852 722 | 7,535 48 | 3,722 51 | 3,813 -3 |
| 2017-18 | 32,166 155 | 24,503 27 | 11,561 -63 | 12,942 90 | 7,663 128 | 3,729 7 | 3,934 121 |
| 2018-19 | 31,656 -510 | 23,989 -514 | 11,191 -370 | 12,798 -144 | 7,667 4 | 3,676 -53 | 3,991 57 |
| 2019-20 | 31,240 -416 | 23,482 -507 | 10,830 -361 | 12,652 -146 | 7,758 91 | 3,677 1 | 4,081 90 |
| 2020-21 | 30,318 -922 | 22,304 -1,178 | 10,091 -739 | 12,213 -439 | 8,014 256 | 3,700 23 | 4,314 233 |
| 2021-22 | 29,909 -409 | 21,608 -696 | 9,564 -527 | 12,044 -169 | 8,301 287 | 3,828 128 | 4,473 159 |
| 2022-23 | 30,015 106 | 21,973 365 | 9,651 87 | 12,322 278 | 8,042 -259 | 3,665 -163 | 4,377 -96 |
| Average | 30,728 | 22,911 | 10,701 | 12,209 | 7,817 | 3,739 | 4,078 |