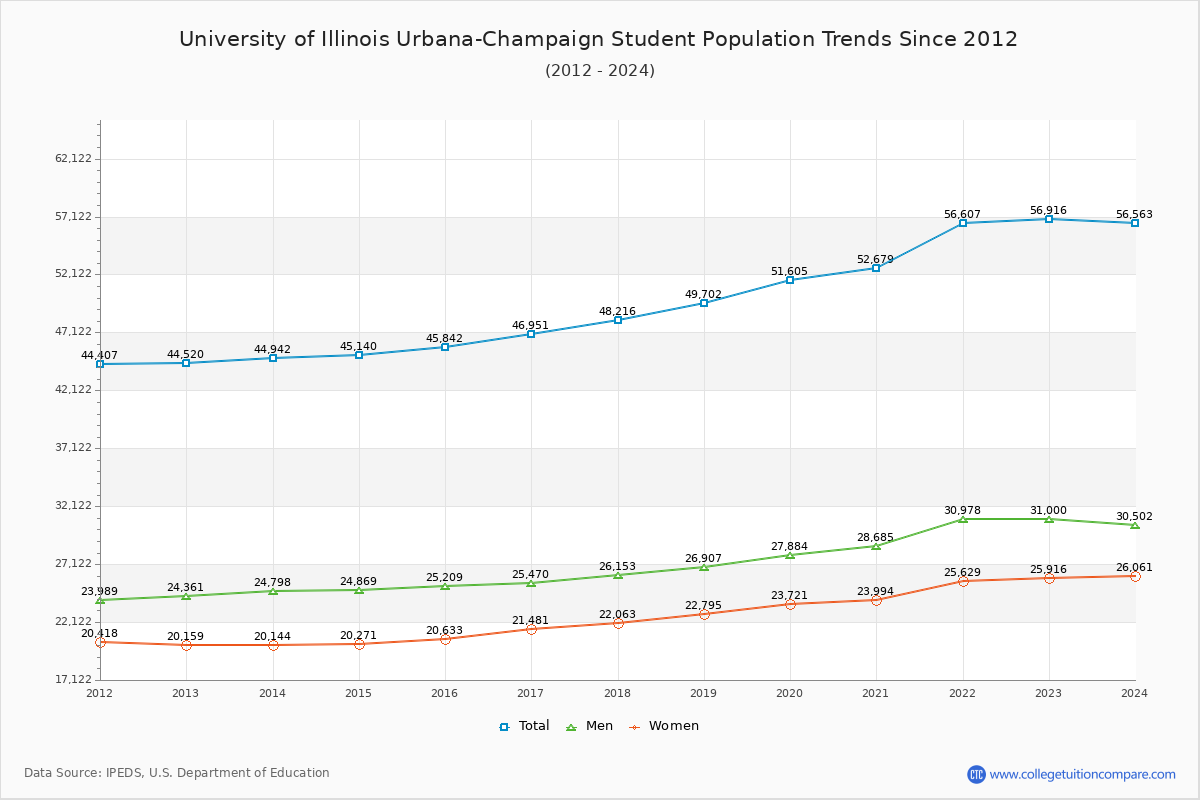
Student Population Changes
The average student population over the last 12 years is 49,375 where 56,916 students are attending the school for the academic year 2022-2023.
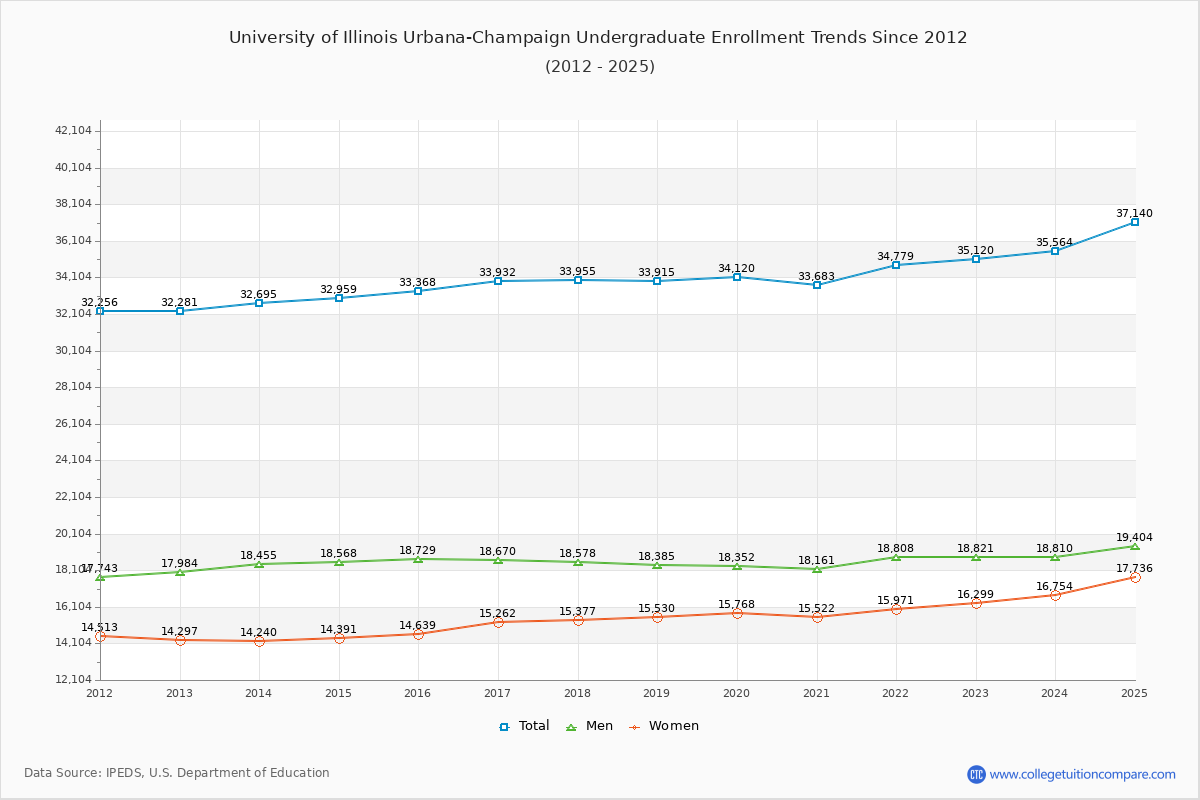
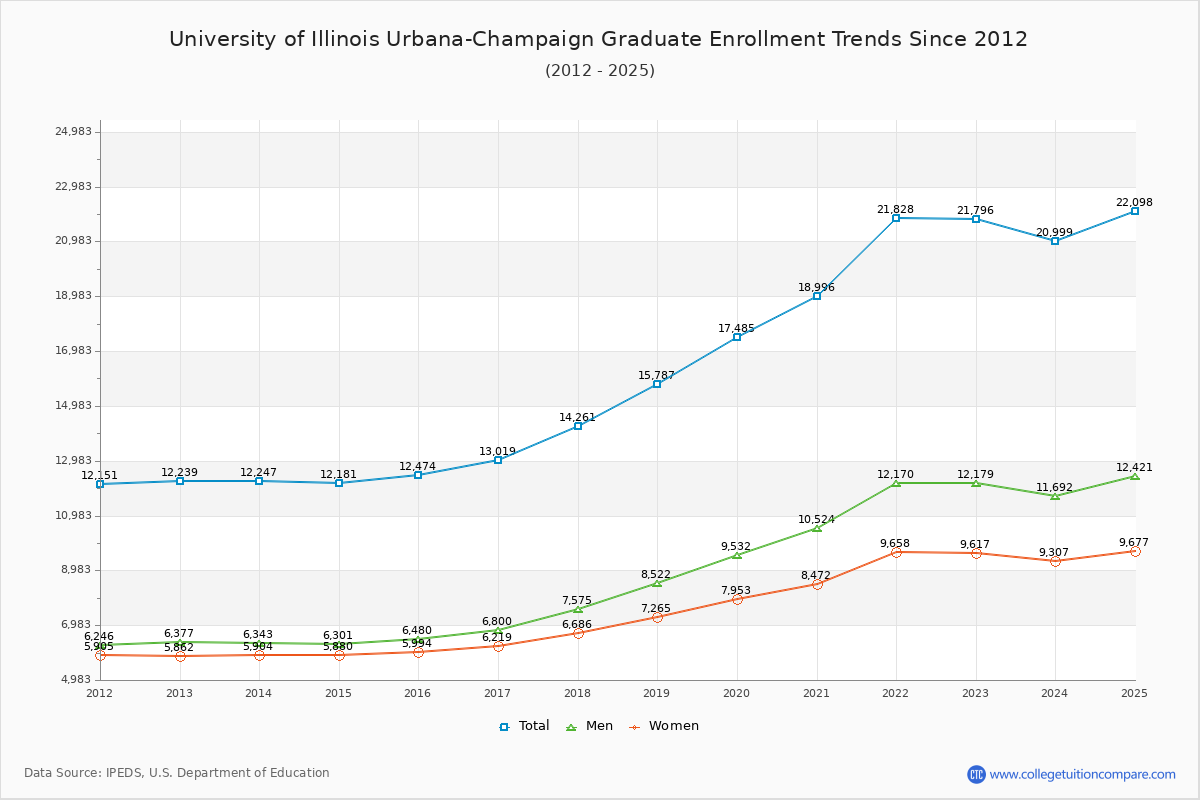
61.70% of total students is undergraduate students and 38.30% students is graduate students. The number of undergraduate students has increased by 2,839 and the graduate enrollment has increased by 9,557 over past 10 years.
The female to male ratio is 0.84 to 1 and it means that there are slightly more male students enrolled in UIUC than female students.
The following table and chart illustrate the changes in student population by gender at University of Illinois Urbana-Champaign since 2012.
| Year | Total | Undergraduate | Graduate | ||||
|---|---|---|---|---|---|---|---|
| Total | Men | Women | Total | Men | Women | ||
| 2012-13 | 44,520 | 32,281 | 17,984 | 14,297 | 12,239 | 6,377 | 5,862 |
| 2013-14 | 44,942 422 | 32,695 414 | 18,455 471 | 14,240 -57 | 12,247 8 | 6,343 -34 | 5,904 42 |
| 2014-15 | 45,140 198 | 32,959 264 | 18,568 113 | 14,391 151 | 12,181 -66 | 6,301 -42 | 5,880 -24 |
| 2015-16 | 45,842 702 | 33,368 409 | 18,729 161 | 14,639 248 | 12,474 293 | 6,480 179 | 5,994 114 |
| 2016-17 | 46,951 1,109 | 33,932 564 | 18,670 -59 | 15,262 623 | 13,019 545 | 6,800 320 | 6,219 225 |
| 2017-18 | 48,216 1,265 | 33,955 23 | 18,578 -92 | 15,377 115 | 14,261 1,242 | 7,575 775 | 6,686 467 |
| 2018-19 | 49,702 1,486 | 33,915 -40 | 18,385 -193 | 15,530 153 | 15,787 1,526 | 8,522 947 | 7,265 579 |
| 2019-20 | 51,605 1,903 | 34,120 205 | 18,352 -33 | 15,768 238 | 17,485 1,698 | 9,532 1,010 | 7,953 688 |
| 2020-21 | 52,679 1,074 | 33,683 -437 | 18,161 -191 | 15,522 -246 | 18,996 1,511 | 10,524 992 | 8,472 519 |
| 2021-22 | 56,607 3,928 | 34,779 1,096 | 18,808 647 | 15,971 449 | 21,828 2,832 | 12,170 1,646 | 9,658 1,186 |
| 2022-23 | 56,916 309 | 35,120 341 | 18,821 13 | 16,299 328 | 21,796 -32 | 12,179 9 | 9,617 -41 |
| Average | 49,375 | 33,710 | 18,501 | 15,209 | 15,665 | 8,437 | 7,228 |