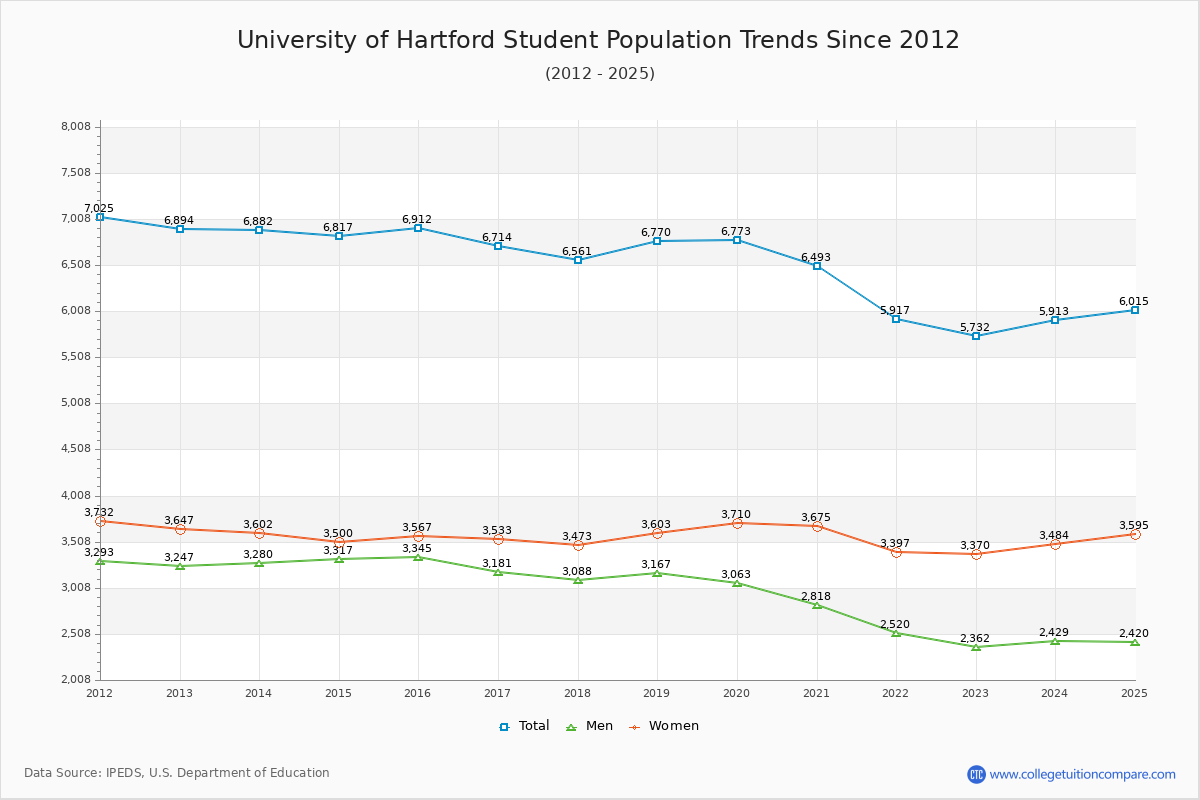
Student Population Changes
The average student population over the last 12 years is 6,588 where 5,732 students are attending the school for the academic year 2022-2023.
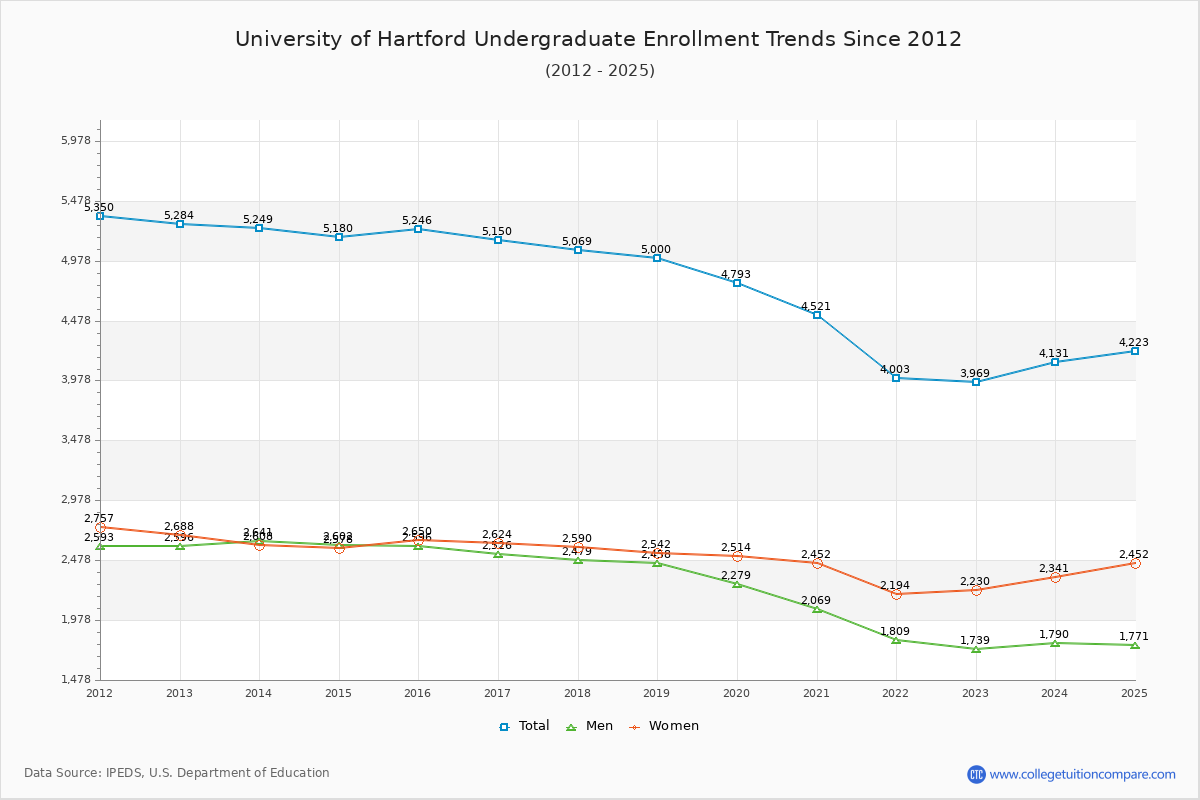
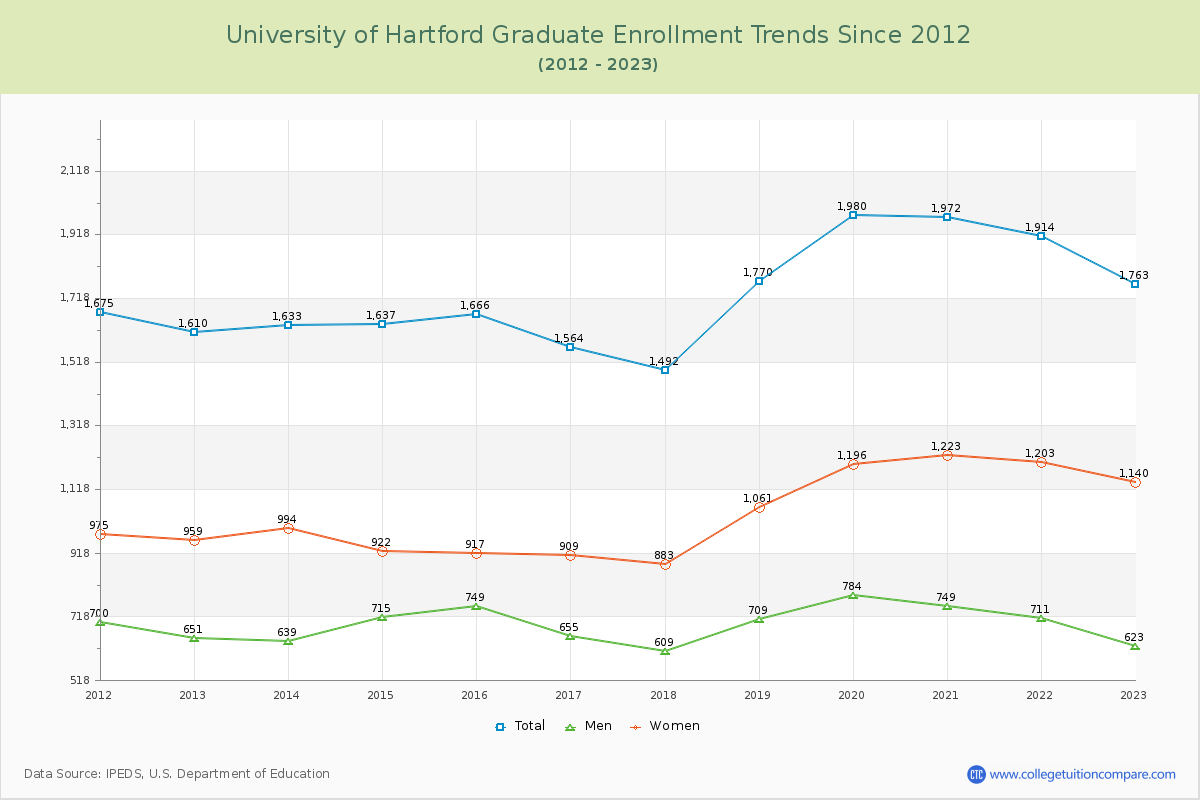
69.24% of total students is undergraduate students and 30.76% students is graduate students. The number of undergraduate students has decreased by 1,315 and the graduate enrollment has increased by 153 over past 10 years.
The female to male ratio is 1.43 to 1 and it means that there are more female students enrolled in UHA than male students.
The following table and chart illustrate the changes in student population by gender at University of Hartford since 2012.
| Year | Total | Undergraduate | Graduate | ||||
|---|---|---|---|---|---|---|---|
| Total | Men | Women | Total | Men | Women | ||
| 2012-13 | 6,894 | 5,284 | 2,596 | 2,688 | 1,610 | 651 | 959 |
| 2013-14 | 6,882 -12 | 5,249 -35 | 2,641 45 | 2,608 -80 | 1,633 23 | 639 -12 | 994 35 |
| 2014-15 | 6,817 -65 | 5,180 -69 | 2,602 -39 | 2,578 -30 | 1,637 4 | 715 76 | 922 -72 |
| 2015-16 | 6,912 95 | 5,246 66 | 2,596 -6 | 2,650 72 | 1,666 29 | 749 34 | 917 -5 |
| 2016-17 | 6,714 -198 | 5,150 -96 | 2,526 -70 | 2,624 -26 | 1,564 -102 | 655 -94 | 909 -8 |
| 2017-18 | 6,561 -153 | 5,069 -81 | 2,479 -47 | 2,590 -34 | 1,492 -72 | 609 -46 | 883 -26 |
| 2018-19 | 6,770 209 | 5,000 -69 | 2,458 -21 | 2,542 -48 | 1,770 278 | 709 100 | 1,061 178 |
| 2019-20 | 6,773 3 | 4,793 -207 | 2,279 -179 | 2,514 -28 | 1,980 210 | 784 75 | 1,196 135 |
| 2020-21 | 6,493 -280 | 4,521 -272 | 2,069 -210 | 2,452 -62 | 1,972 -8 | 749 -35 | 1,223 27 |
| 2021-22 | 5,917 -576 | 4,003 -518 | 1,809 -260 | 2,194 -258 | 1,914 -58 | 711 -38 | 1,203 -20 |
| 2022-23 | 5,732 -185 | 3,969 -34 | 1,739 -70 | 2,230 36 | 1,763 -151 | 623 -88 | 1,140 -63 |
| Average | 6,588 | 4,860 | 2,345 | 2,515 | 1,727 | 690 | 1,037 |