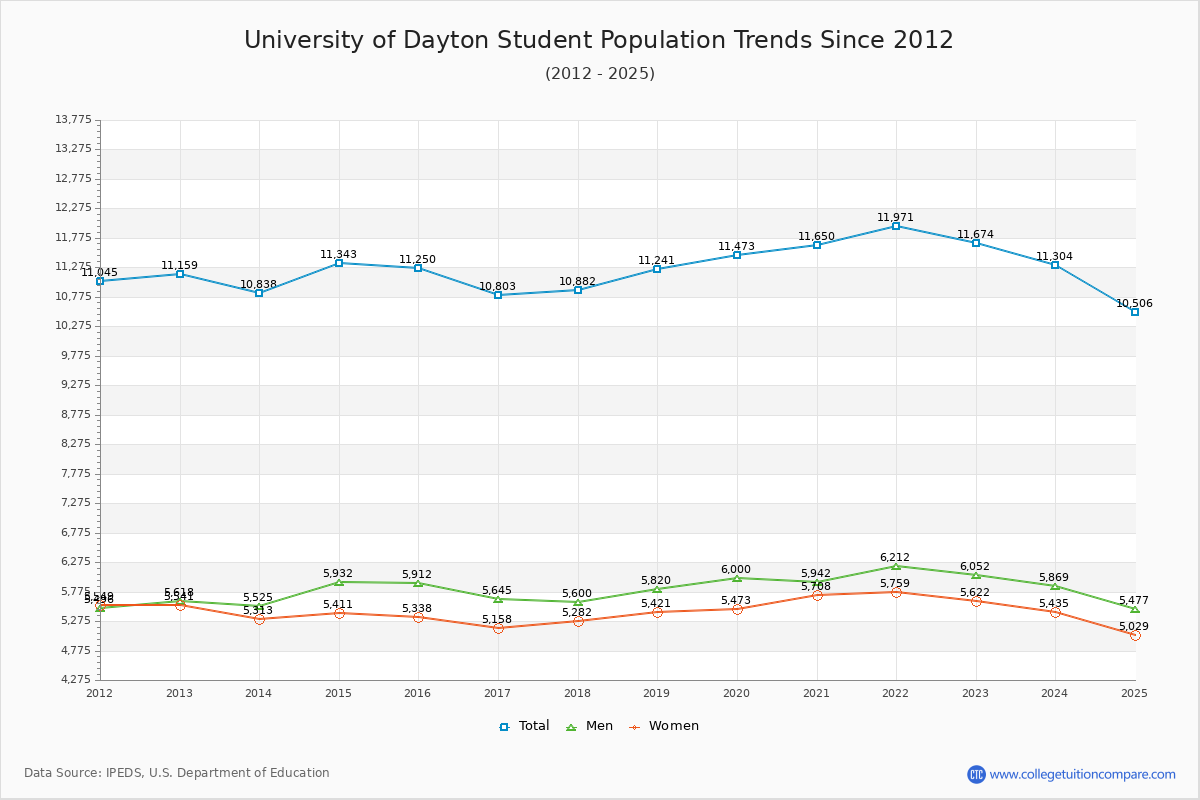
Student Population Changes
The average student population over the last 12 years is 11,299 where 11,674 students are attending the school for the academic year 2022-2023.
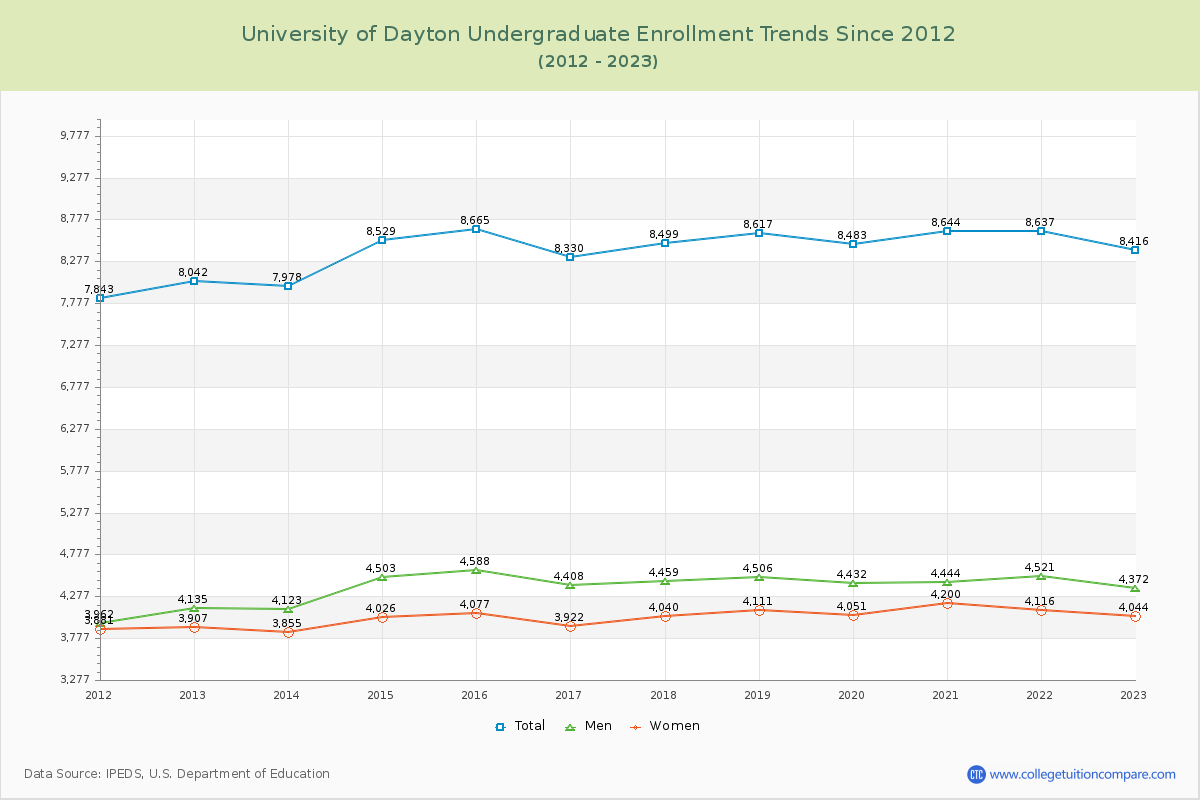
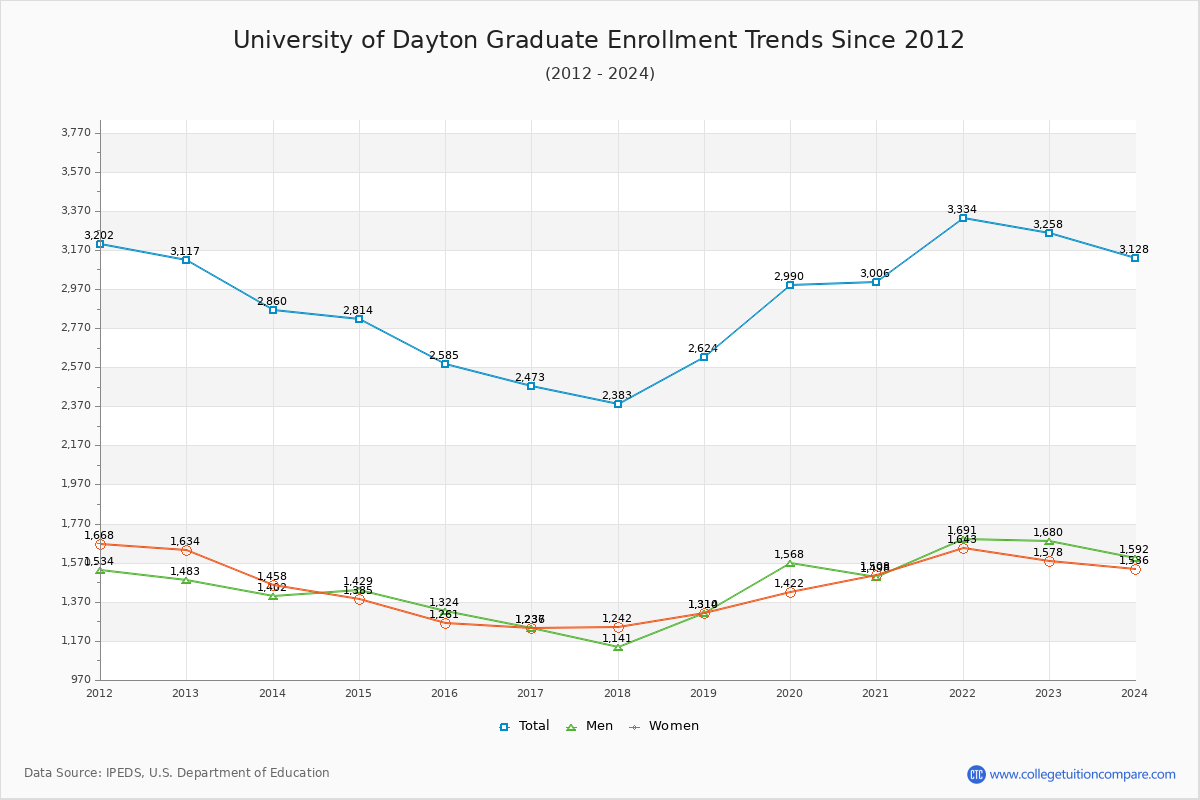
72.09% of total students is undergraduate students and 27.91% students is graduate students. The number of undergraduate students has increased by 374 and the graduate enrollment has increased by 141 over past 10 years.
The female to male ratio is 0.93 to 1 and it means that there are similar numbers of female and male students enrolled in U of Dayton.
The following table and chart illustrate the changes in student population by gender at University of Dayton since 2012.
| Year | Total | Undergraduate | Graduate | ||||
|---|---|---|---|---|---|---|---|
| Total | Men | Women | Total | Men | Women | ||
| 2012-13 | 11,159 | 8,042 | 4,135 | 3,907 | 3,117 | 1,483 | 1,634 |
| 2013-14 | 10,838 -321 | 7,978 -64 | 4,123 -12 | 3,855 -52 | 2,860 -257 | 1,402 -81 | 1,458 -176 |
| 2014-15 | 11,343 505 | 8,529 551 | 4,503 380 | 4,026 171 | 2,814 -46 | 1,429 27 | 1,385 -73 |
| 2015-16 | 11,250 -93 | 8,665 136 | 4,588 85 | 4,077 51 | 2,585 -229 | 1,324 -105 | 1,261 -124 |
| 2016-17 | 10,803 -447 | 8,330 -335 | 4,408 -180 | 3,922 -155 | 2,473 -112 | 1,237 -87 | 1,236 -25 |
| 2017-18 | 10,882 79 | 8,499 169 | 4,459 51 | 4,040 118 | 2,383 -90 | 1,141 -96 | 1,242 6 |
| 2018-19 | 11,241 359 | 8,617 118 | 4,506 47 | 4,111 71 | 2,624 241 | 1,314 173 | 1,310 68 |
| 2019-20 | 11,473 232 | 8,483 -134 | 4,432 -74 | 4,051 -60 | 2,990 366 | 1,568 254 | 1,422 112 |
| 2020-21 | 11,650 177 | 8,644 161 | 4,444 12 | 4,200 149 | 3,006 16 | 1,498 -70 | 1,508 86 |
| 2021-22 | 11,971 321 | 8,637 -7 | 4,521 77 | 4,116 -84 | 3,334 328 | 1,691 193 | 1,643 135 |
| 2022-23 | 11,674 -297 | 8,416 -221 | 4,372 -149 | 4,044 -72 | 3,258 -76 | 1,680 -11 | 1,578 -65 |
| Average | 11,299 | 8,440 | 4,408 | 4,032 | 2,859 | 1,433 | 1,425 |