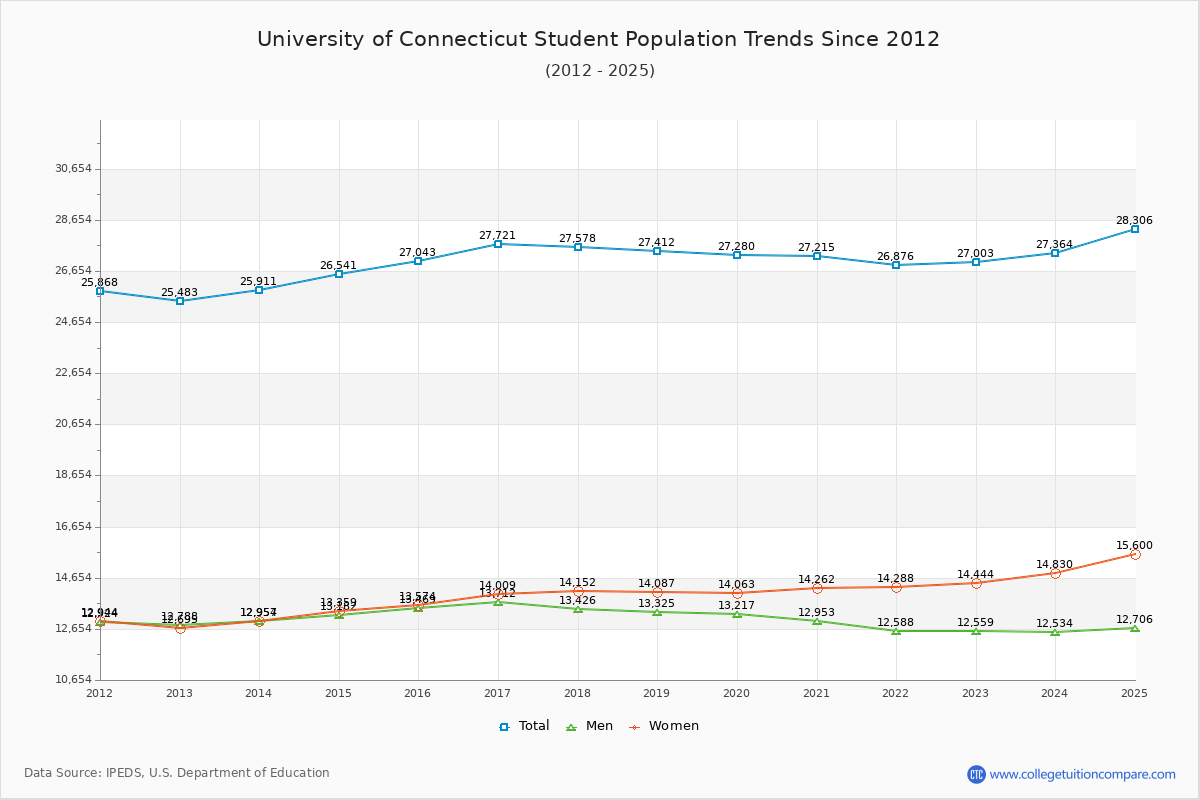
Student Population Changes
The average student population over the last 12 years is 26,915 where 27,003 students are attending the school for the academic year 2022-2023.
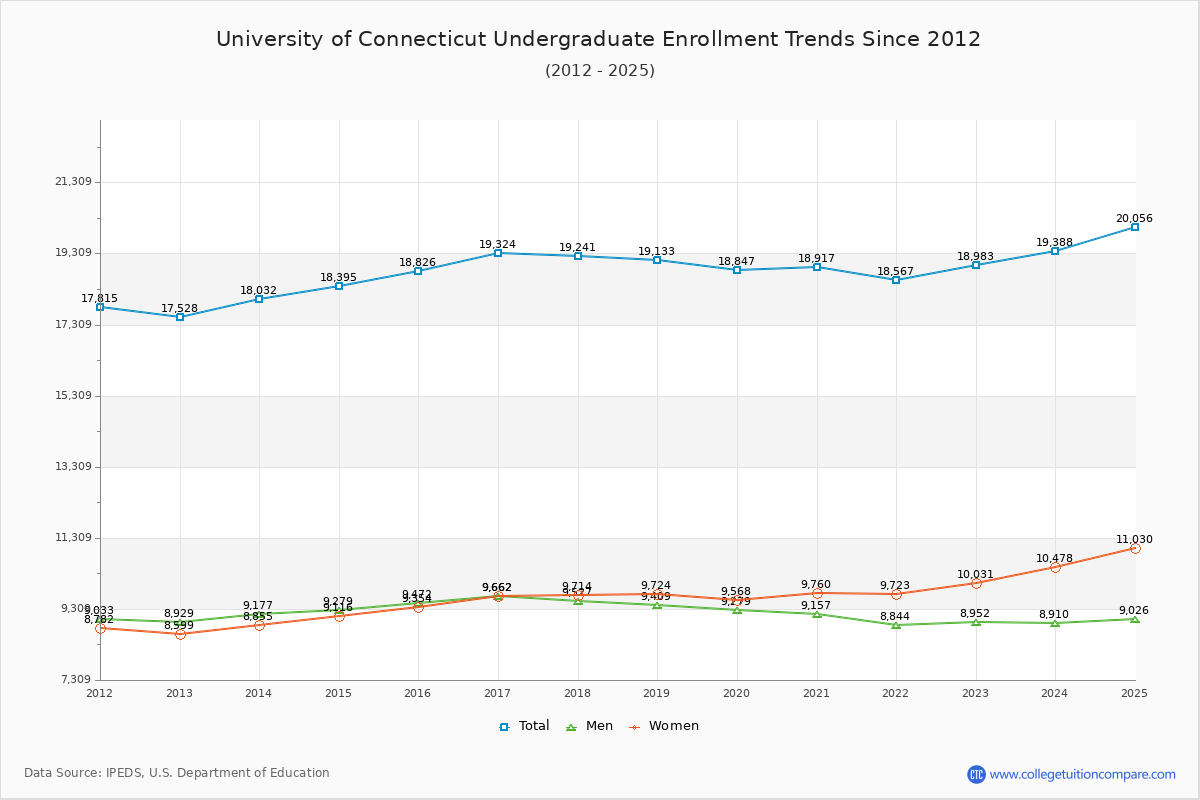
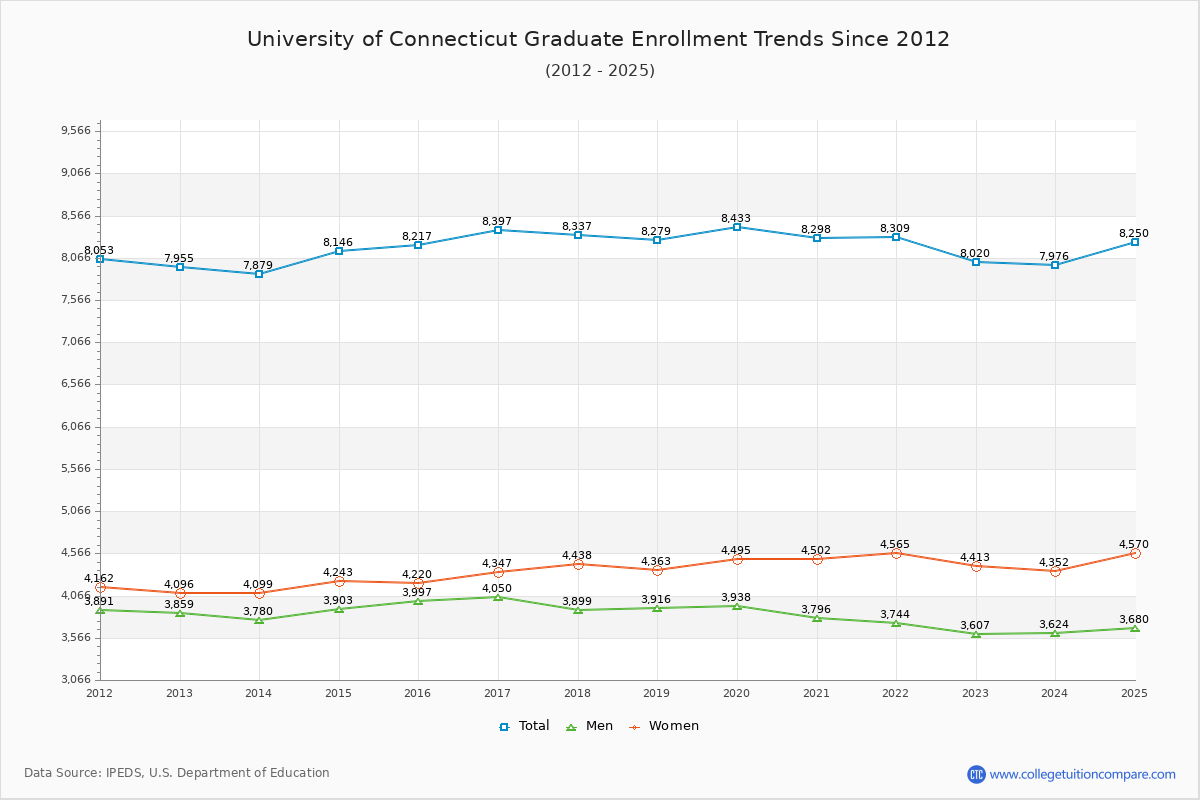
70.30% of total students is undergraduate students and 29.70% students is graduate students. The number of undergraduate students has increased by 1,455 and the graduate enrollment has increased by 65 over past 10 years.
The female to male ratio is 1.15 to 1 and it means that there are slightly more female students enrolled in U of Connecticut than male students.
The following table and chart illustrate the changes in student population by gender at University of Connecticut since 2012.
| Year | Total | Undergraduate | Graduate | ||||
|---|---|---|---|---|---|---|---|
| Total | Men | Women | Total | Men | Women | ||
| 2012-13 | 25,483 | 17,528 | 8,929 | 8,599 | 7,955 | 3,859 | 4,096 |
| 2013-14 | 25,911 428 | 18,032 504 | 9,177 248 | 8,855 256 | 7,879 -76 | 3,780 -79 | 4,099 3 |
| 2014-15 | 26,541 630 | 18,395 363 | 9,279 102 | 9,116 261 | 8,146 267 | 3,903 123 | 4,243 144 |
| 2015-16 | 27,043 502 | 18,826 431 | 9,472 193 | 9,354 238 | 8,217 71 | 3,997 94 | 4,220 -23 |
| 2016-17 | 27,721 678 | 19,324 498 | 9,662 190 | 9,662 308 | 8,397 180 | 4,050 53 | 4,347 127 |
| 2017-18 | 27,578 -143 | 19,241 -83 | 9,527 -135 | 9,714 52 | 8,337 -60 | 3,899 -151 | 4,438 91 |
| 2018-19 | 27,412 -166 | 19,133 -108 | 9,409 -118 | 9,724 10 | 8,279 -58 | 3,916 17 | 4,363 -75 |
| 2019-20 | 27,280 -132 | 18,847 -286 | 9,279 -130 | 9,568 -156 | 8,433 154 | 3,938 22 | 4,495 132 |
| 2020-21 | 27,215 -65 | 18,917 70 | 9,157 -122 | 9,760 192 | 8,298 -135 | 3,796 -142 | 4,502 7 |
| 2021-22 | 26,876 -339 | 18,567 -350 | 8,844 -313 | 9,723 -37 | 8,309 11 | 3,744 -52 | 4,565 63 |
| 2022-23 | 27,003 127 | 18,983 416 | 8,952 108 | 10,031 308 | 8,020 -289 | 3,607 -137 | 4,413 -152 |
| Average | 26,915 | 18,708 | 9,244 | 9,464 | 8,206 | 3,863 | 4,344 |