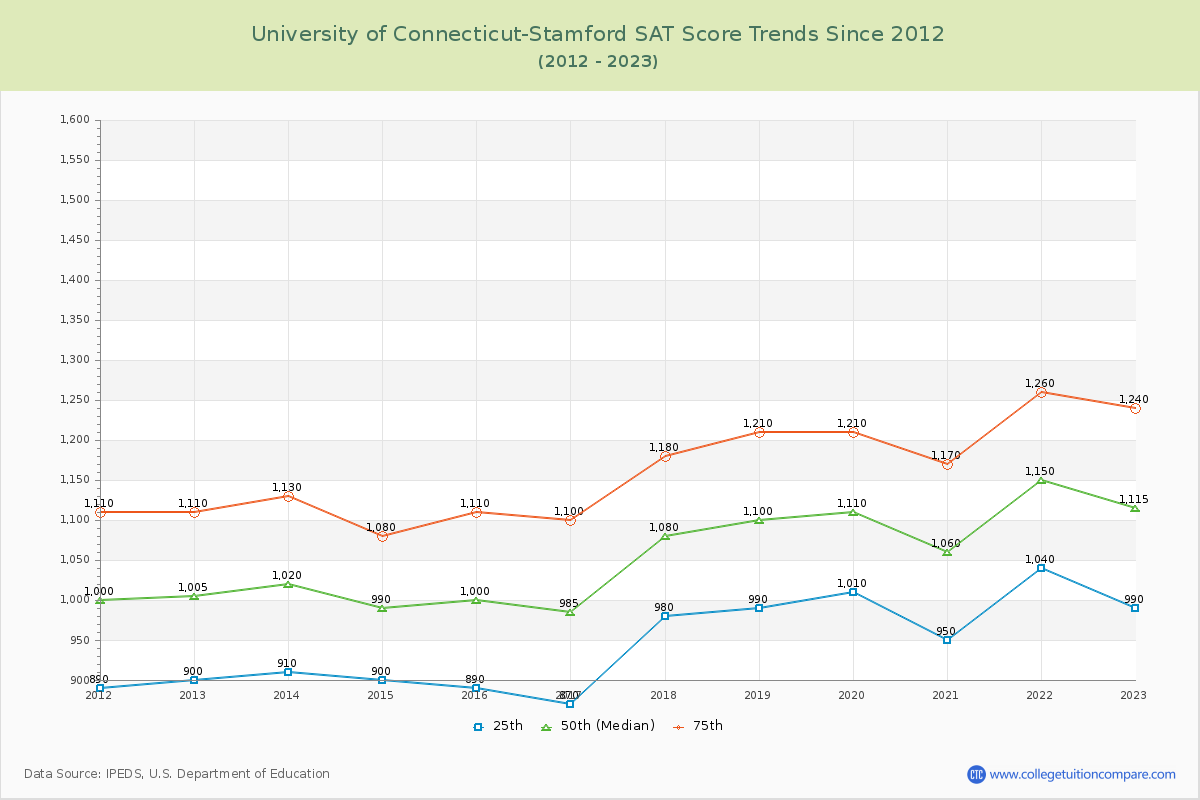
SAT Scores Over Time
The 2023 SAT score is 1115 at U of Connecticut-Stamford. Over the past 12 years, the average SAT score is 948 (25th percentile) and 1164 (75th percentile). Compared to similar schools, the submitted SAT scores are around national average at U of Connecticut-Stamford.
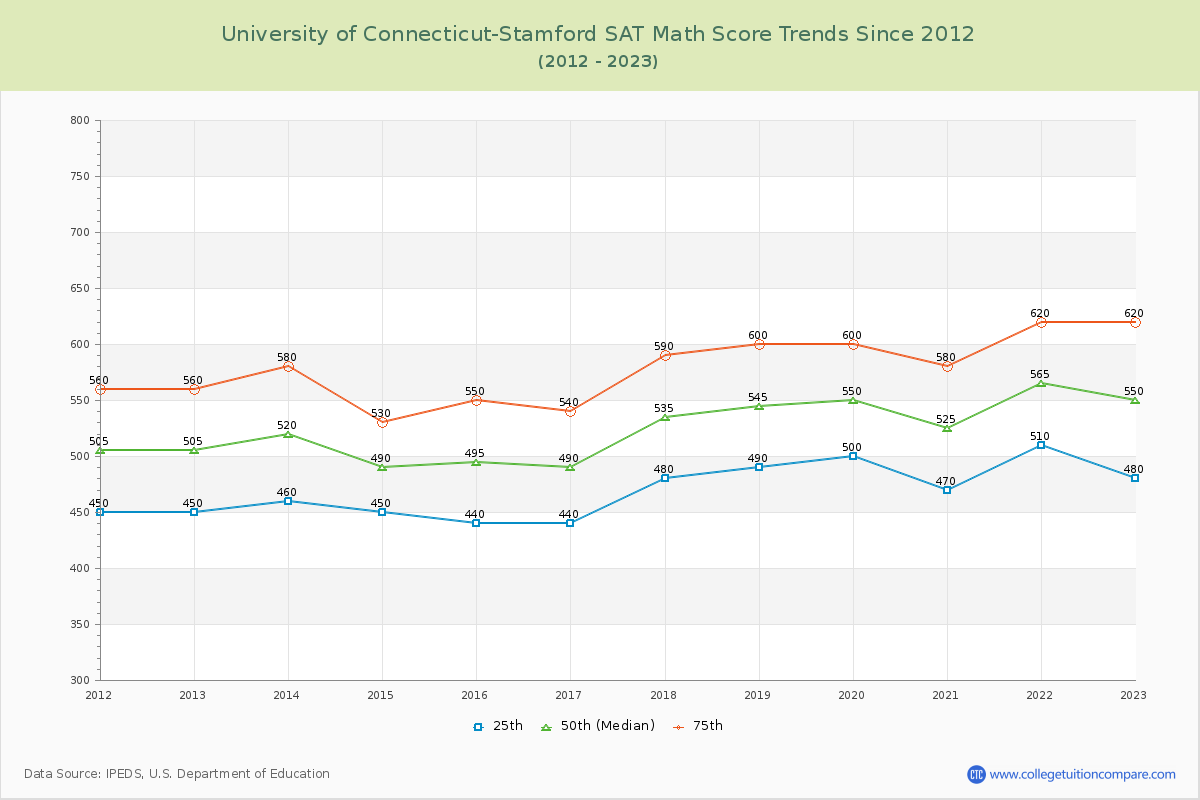
The following table and chart illustrate the changes in SAT scores at University of Connecticut-Stamford since 2012.
| Year | Total | Math | Evidence-Based Reading and Writing | ||||||
|---|---|---|---|---|---|---|---|---|---|
| 25th | 50th | 75th | 25th | 50th | 75th | 25th | 50th | 75th | |
| 2012-13 | 900 | 1,005 | 1,110 | 450 | 505 | 560 | 450 | 500 | 550 |
| 2013-14 | 910 | 1,020 | 1,130 | 460 | 520 | 580 | 450 | 500 | 550 |
| 2014-15 | 900 | 990 | 1,080 | 450 | 490 | 530 | 450 | 500 | 550 |
| 2015-16 | 890 | 1,000 | 1,110 | 440 | 495 | 550 | 450 | 505 | 560 |
| 2016-17 | 870 | 985 | 1,100 | 440 | 490 | 540 | 430 | 495 | 560 |
| 2017-18 | 980 | 1,080 | 1,180 | 480 | 535 | 590 | 500 | 545 | 590 |
| 2018-19 | 990 | 1,100 | 1,210 | 490 | 545 | 600 | 500 | 555 | 610 |
| 2019-20 | 1,010 | 1,110 | 1,210 | 500 | 550 | 600 | 510 | 560 | 610 |
| 2020-21 | 950 | 1,060 | 1,170 | 470 | 525 | 580 | 480 | 535 | 590 |
| 2021-22 | 1,040 | 1,150 | 1,260 | 510 | 565 | 620 | 530 | 585 | 640 |
| 2022-23 | 990 | 1,115 | 1,240 | 480 | 550 | 620 | 510 | 565 | 620 |
| Average | 948 | 1056 | 1164 | 470 | 525 | 579 | 478 | 531 | 585 |
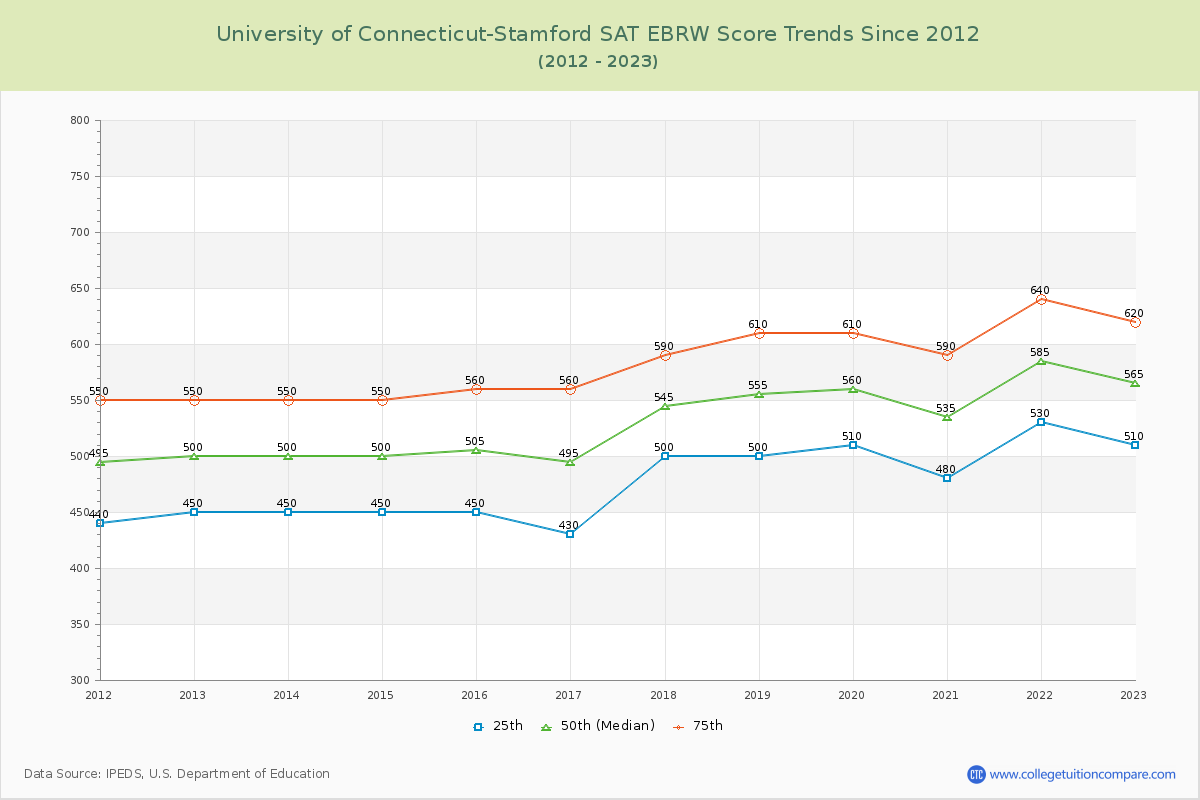
*SAT Evidence-Based Reading and Writing replaces SAT critical reading and writing since year 2017.
**The SAT Writing score is excluded from the total scores for year from 2011 to 2016.