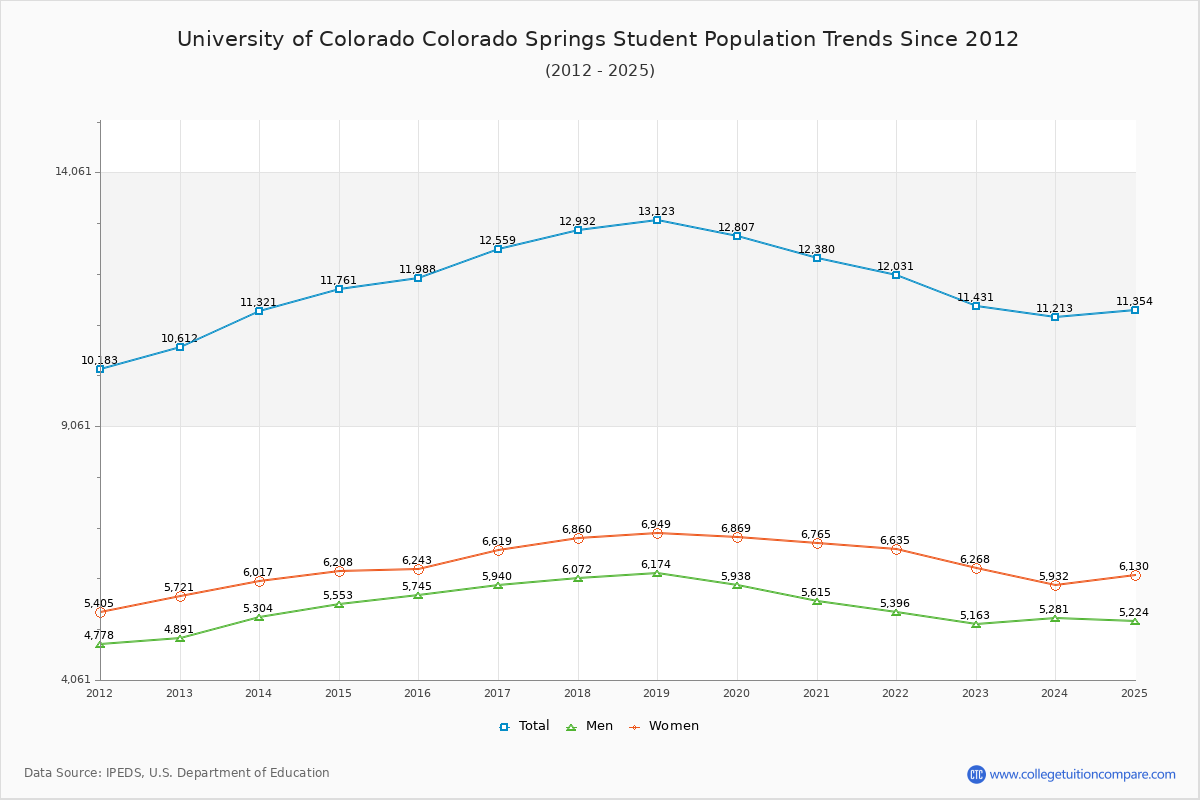
Student Population Changes
The average student population over the last 12 years is 12,086 where 11,431 students are attending the school for the academic year 2022-2023.
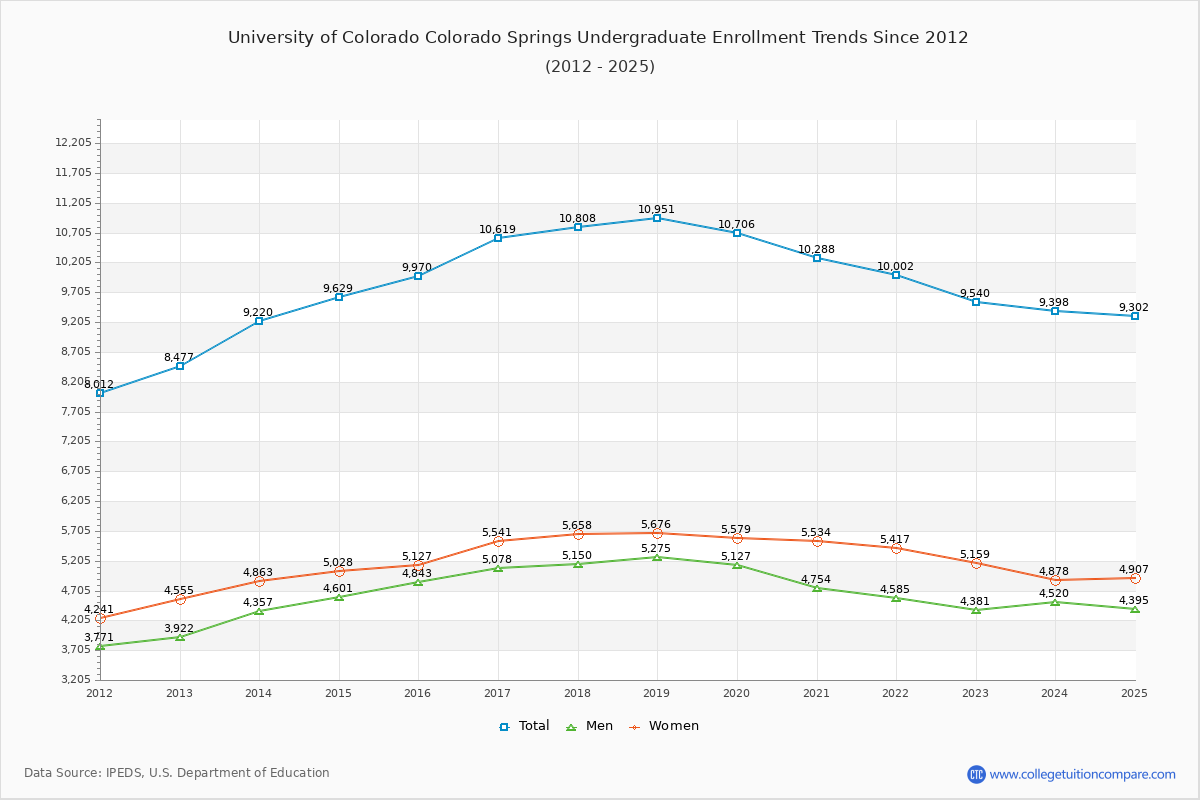
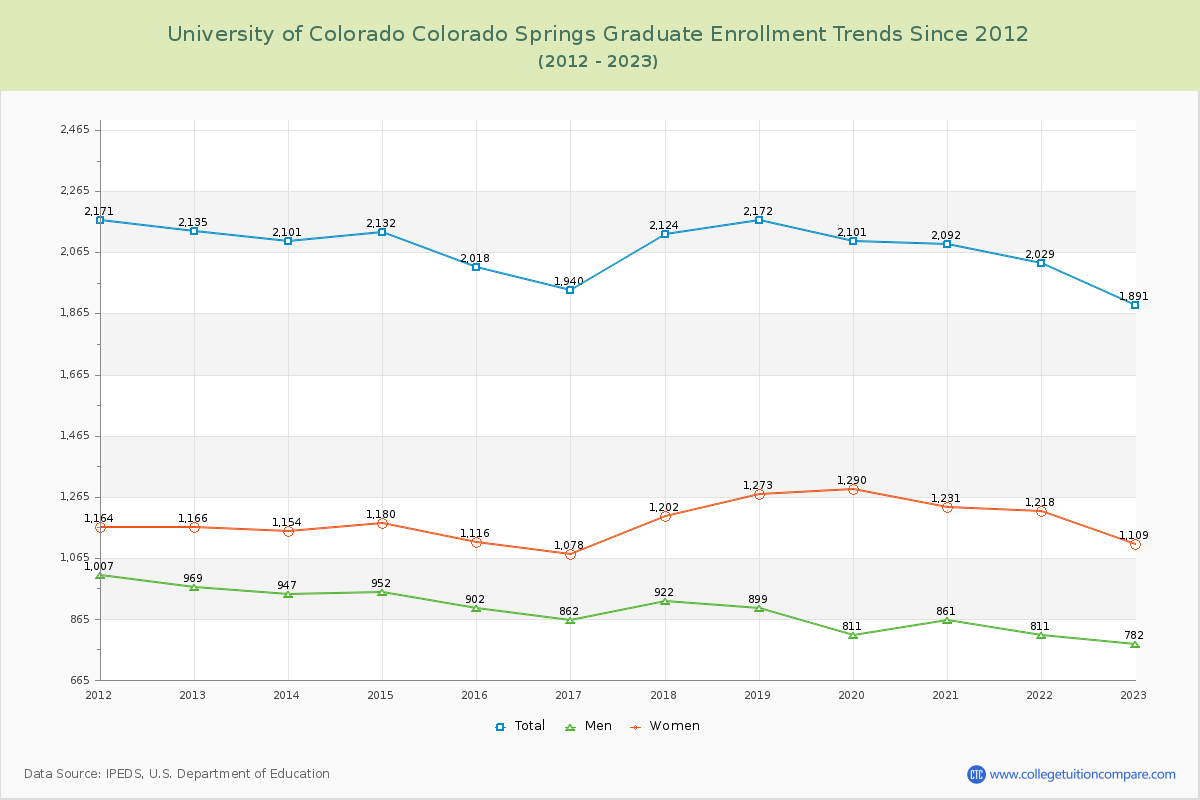
83.46% of total students is undergraduate students and 16.54% students is graduate students. The number of undergraduate students has increased by 1,063 and the graduate enrollment has decreased by 244 over past 10 years.
The female to male ratio is 1.21 to 1 and it means that there are slightly more female students enrolled in UCCS than male students.
The following table and chart illustrate the changes in student population by gender at University of Colorado Colorado Springs since 2012.
| Year | Total | Undergraduate | Graduate | ||||
|---|---|---|---|---|---|---|---|
| Total | Men | Women | Total | Men | Women | ||
| 2012-13 | 10,612 | 8,477 | 3,922 | 4,555 | 2,135 | 969 | 1,166 |
| 2013-14 | 11,321 709 | 9,220 743 | 4,357 435 | 4,863 308 | 2,101 -34 | 947 -22 | 1,154 -12 |
| 2014-15 | 11,761 440 | 9,629 409 | 4,601 244 | 5,028 165 | 2,132 31 | 952 5 | 1,180 26 |
| 2015-16 | 11,988 227 | 9,970 341 | 4,843 242 | 5,127 99 | 2,018 -114 | 902 -50 | 1,116 -64 |
| 2016-17 | 12,559 571 | 10,619 649 | 5,078 235 | 5,541 414 | 1,940 -78 | 862 -40 | 1,078 -38 |
| 2017-18 | 12,932 373 | 10,808 189 | 5,150 72 | 5,658 117 | 2,124 184 | 922 60 | 1,202 124 |
| 2018-19 | 13,123 191 | 10,951 143 | 5,275 125 | 5,676 18 | 2,172 48 | 899 -23 | 1,273 71 |
| 2019-20 | 12,807 -316 | 10,706 -245 | 5,127 -148 | 5,579 -97 | 2,101 -71 | 811 -88 | 1,290 17 |
| 2020-21 | 12,380 -427 | 10,288 -418 | 4,754 -373 | 5,534 -45 | 2,092 -9 | 861 50 | 1,231 -59 |
| 2021-22 | 12,031 -349 | 10,002 -286 | 4,585 -169 | 5,417 -117 | 2,029 -63 | 811 -50 | 1,218 -13 |
| 2022-23 | 11,431 -600 | 9,540 -462 | 4,381 -204 | 5,159 -258 | 1,891 -138 | 782 -29 | 1,109 -109 |
| Average | 12,086 | 10,019 | 4,734 | 5,285 | 2,067 | 883 | 1,183 |