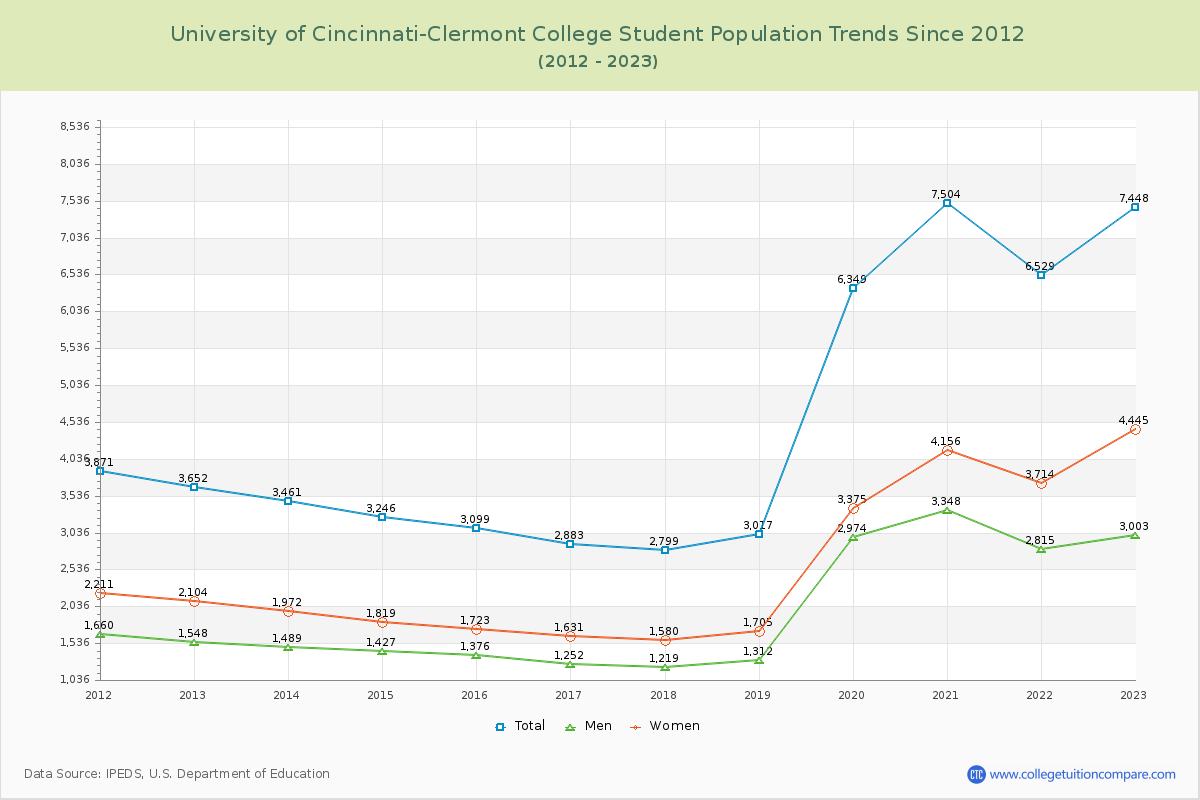
Student Population Changes
The average student population over the last 12 years is 4,541 where 7,448 students are attending the school for the academic year 2022-2023.
The female to male ratio is 1.48 to 1 and it means that there are more female students enrolled in University of Cincinnati-Clermont than male students.
The following table and chart illustrate the changes in student population by gender at University of Cincinnati-Clermont College since 2012.
| Year | Total | Men | Women |
|---|---|---|---|
| 2012-13 | 3,635 | 1,544 | 2,091 |
| 2013-14 | 3,446 -189 | 1,485 -59 | 1,961 -130 |
| 2014-15 | 3,246 -200 | 1,427 -58 | 1,819 -142 |
| 2015-16 | 3,099 -147 | 1,376 -51 | 1,723 -96 |
| 2016-17 | 2,883 -216 | 1,252 -124 | 1,631 -92 |
| 2017-18 | 2,799 -84 | 1,219 -33 | 1,580 -51 |
| 2018-19 | 3,017 218 | 1,312 93 | 1,705 125 |
| 2019-20 | 6,349 3,332 | 2,974 1,662 | 3,375 1,670 |
| 2020-21 | 7,504 1,155 | 3,348 374 | 4,156 781 |
| 2021-22 | 6,529 -975 | 2,815 -533 | 3,714 -442 |
| 2022-23 | 7,448 919 | 3,003 188 | 4,445 731 |
| Average | 4,541 | 1,978 | 2,564 |