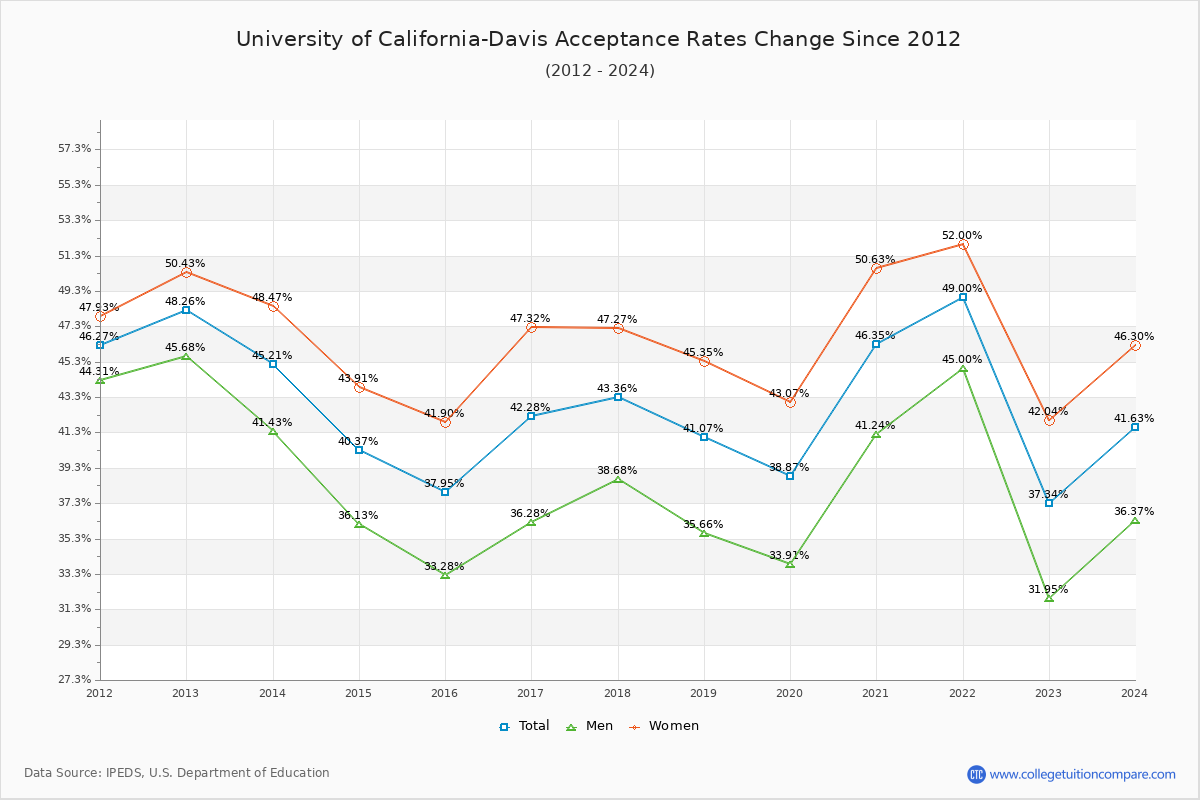
Acceptance Rate Changes
The average acceptance rate over the last 10 years is 42.73%, and this year's acceptance rate is 37.34% at University of California-Davis. By gender, men students' acceptance rate is 38.11% and women students' rate is 46.58%. For 2023 admission, it was slightly harder to get into University of California-Davis than the previous year.
The next table and chart illustrate the acceptance rates changes at University of California-Davis over the past 11 years (2012-2023).
| Year | Total | Men | Women |
|---|---|---|---|
| 2012-13 | 48.26% | 45.68% | 50.43% |
| 2013-14 | 45.21% -3.04% |
41.43% -1.96% |
48.47% -1.96% |
| 2014-15 | 40.37% -4.85% |
36.13% -4.56% |
43.91% -4.56% |
| 2015-16 | 37.95% -2.42% |
33.28% -2.01% |
41.90% -2.01% |
| 2016-17 | 42.28% 4.32% |
36.28% 5.42% |
47.32% 5.42% |
| 2017-18 | 43.36% 1.08% |
38.68% -0.05% |
47.27% -0.05% |
| 2018-19 | 41.07% -2.28% |
35.66% -1.91% |
45.35% -1.91% |
| 2019-20 | 38.87% -2.20% |
33.91% -2.28% |
43.07% -2.28% |
| 2020-21 | 46.35% 7.48% |
41.24% 7.56% |
50.63% 7.56% |
| 2021-22 | 49.00% 2.65% |
45.00% 1.38% |
52.00% 1.38% |
| 2022-23 | 37.34% -11.66% |
31.95% -9.96% |
42.04% -9.96% |
| Average | 42.73% | 38.11% | 46.58% |