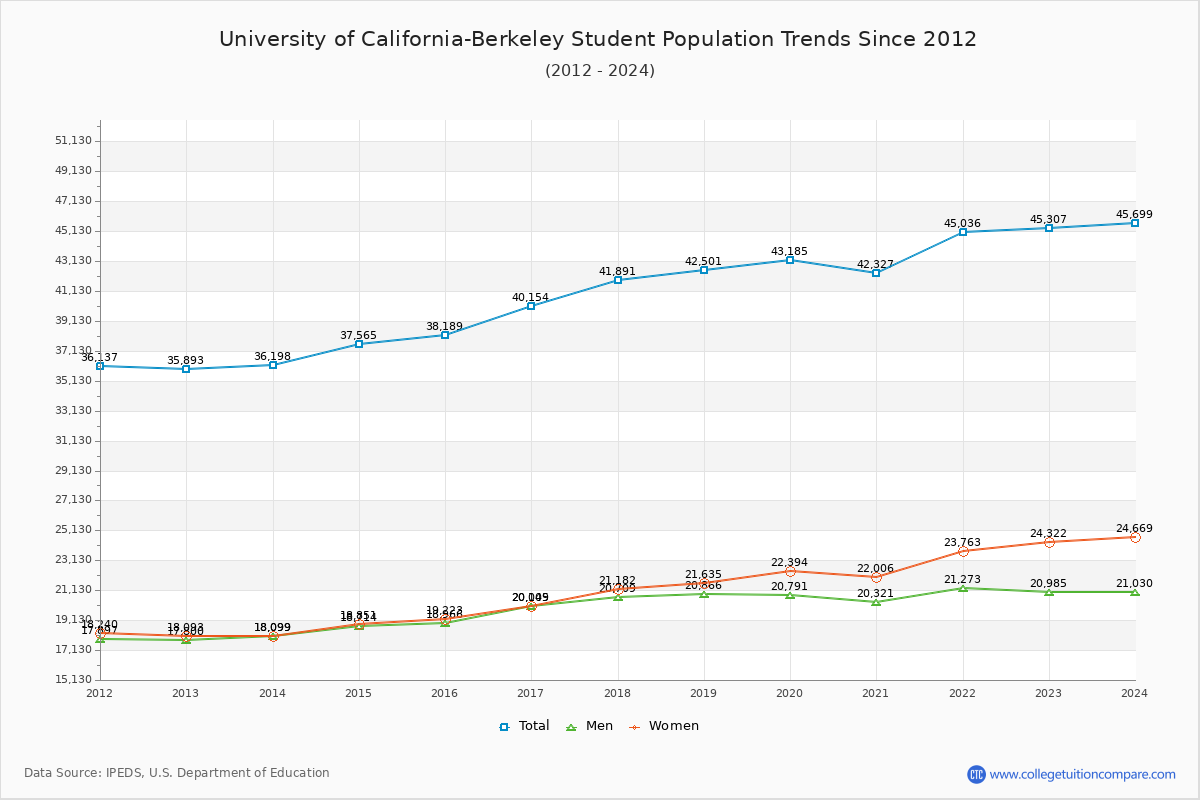
Student Population Changes
The average student population over the last 12 years is 40,750 where 45,307 students are attending the school for the academic year 2022-2023.
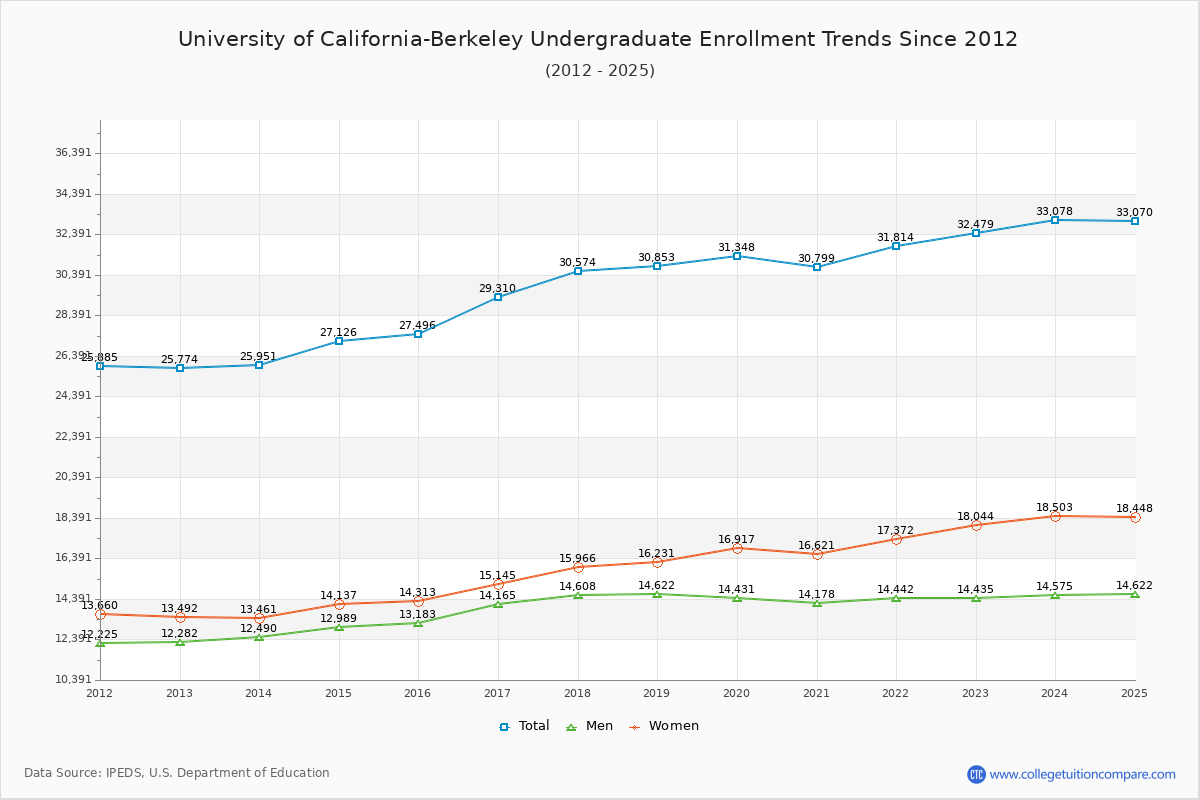
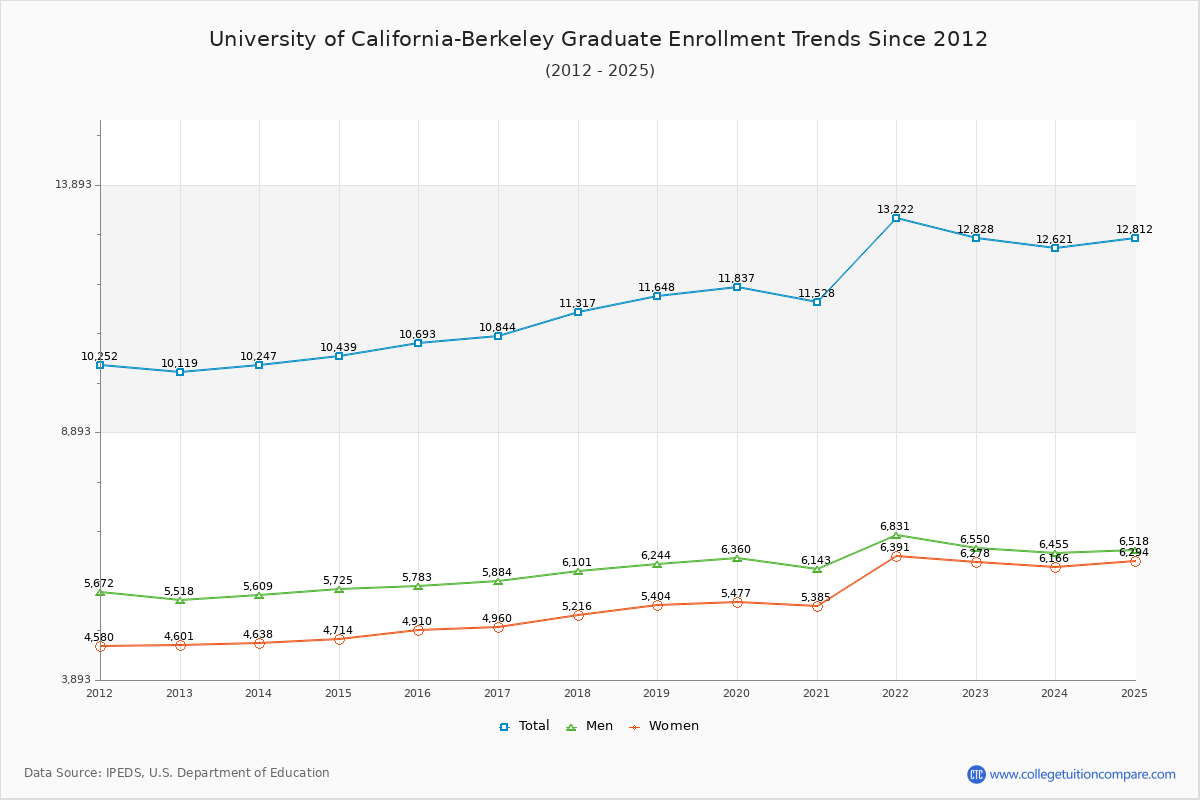
71.69% of total students is undergraduate students and 28.31% students is graduate students. The number of undergraduate students has increased by 6,705 and the graduate enrollment has increased by 2,709 over past 10 years.
The female to male ratio is 1.16 to 1 and it means that there are slightly more female students enrolled in UC Berkeley than male students.
The following table and chart illustrate the changes in student population by gender at University of California-Berkeley since 2012.
| Year | Total | Undergraduate | Graduate | ||||
|---|---|---|---|---|---|---|---|
| Total | Men | Women | Total | Men | Women | ||
| 2012-13 | 35,893 | 25,774 | 12,282 | 13,492 | 10,119 | 5,518 | 4,601 |
| 2013-14 | 36,198 305 | 25,951 177 | 12,490 208 | 13,461 -31 | 10,247 128 | 5,609 91 | 4,638 37 |
| 2014-15 | 37,565 1,367 | 27,126 1,175 | 12,989 499 | 14,137 676 | 10,439 192 | 5,725 116 | 4,714 76 |
| 2015-16 | 38,189 624 | 27,496 370 | 13,183 194 | 14,313 176 | 10,693 254 | 5,783 58 | 4,910 196 |
| 2016-17 | 40,154 1,965 | 29,310 1,814 | 14,165 982 | 15,145 832 | 10,844 151 | 5,884 101 | 4,960 50 |
| 2017-18 | 41,891 1,737 | 30,574 1,264 | 14,608 443 | 15,966 821 | 11,317 473 | 6,101 217 | 5,216 256 |
| 2018-19 | 42,501 610 | 30,853 279 | 14,622 14 | 16,231 265 | 11,648 331 | 6,244 143 | 5,404 188 |
| 2019-20 | 43,185 684 | 31,348 495 | 14,431 -191 | 16,917 686 | 11,837 189 | 6,360 116 | 5,477 73 |
| 2020-21 | 42,327 -858 | 30,799 -549 | 14,178 -253 | 16,621 -296 | 11,528 -309 | 6,143 -217 | 5,385 -92 |
| 2021-22 | 45,036 2,709 | 31,814 1,015 | 14,442 264 | 17,372 751 | 13,222 1,694 | 6,831 688 | 6,391 1,006 |
| 2022-23 | 45,307 271 | 32,479 665 | 14,435 -7 | 18,044 672 | 12,828 -394 | 6,550 -281 | 6,278 -113 |
| Average | 40,750 | 29,411 | 13,802 | 15,609 | 11,338 | 6,068 | 5,270 |