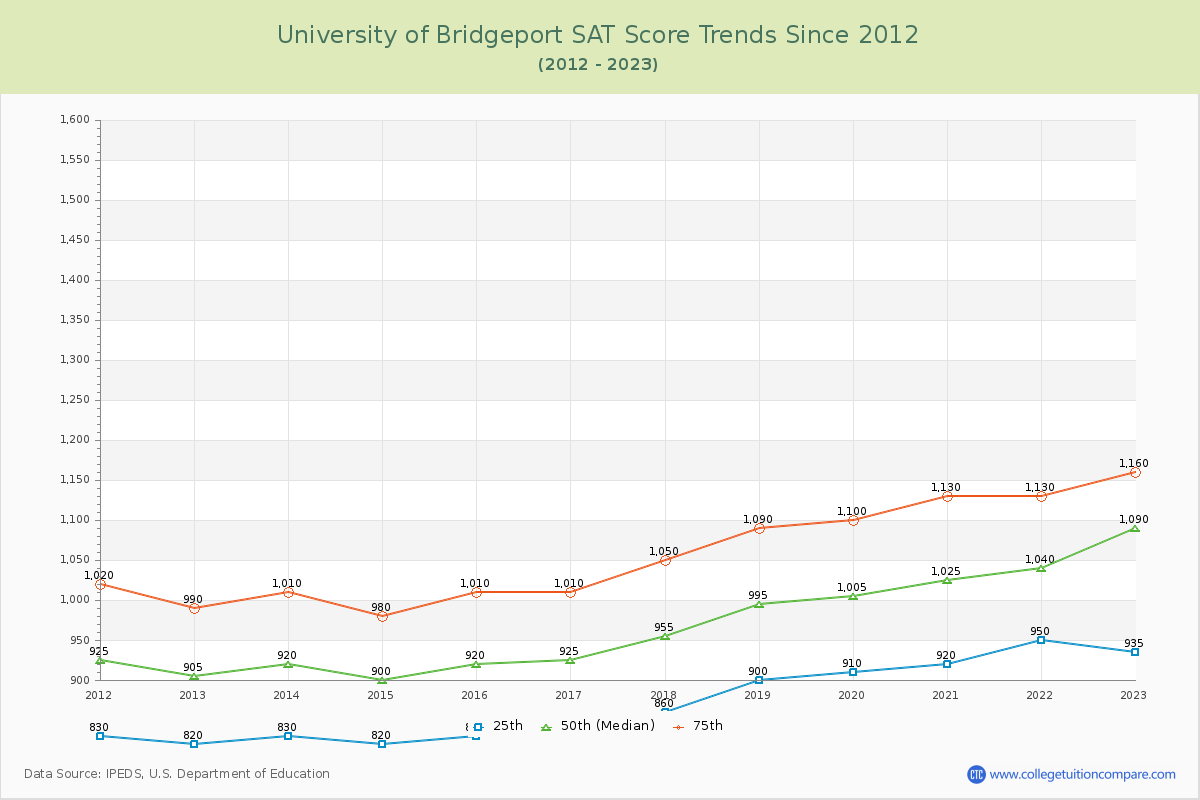
SAT Scores Over Time
The 2023 SAT score is 1090 at U of Bridgeport. Over the past 12 years, the average SAT score is 874 (25th percentile) and 1060 (75th percentile). Compared to similar schools, the submitted SAT scores are around national average at U of Bridgeport.
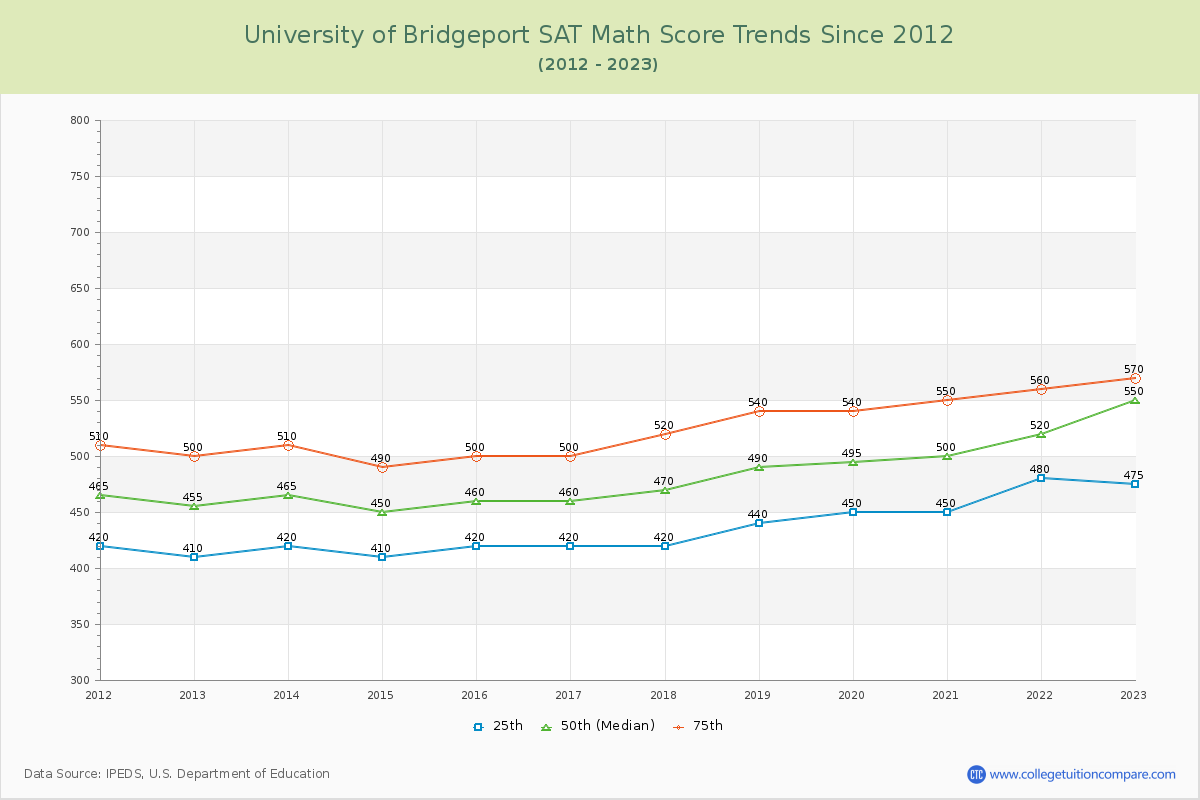
The following table and chart illustrate the changes in SAT scores at University of Bridgeport since 2012.
| Year | Total | Math | Evidence-Based Reading and Writing | ||||||
|---|---|---|---|---|---|---|---|---|---|
| 25th | 50th | 75th | 25th | 50th | 75th | 25th | 50th | 75th | |
| 2012-13 | 820 | 905 | 990 | 410 | 455 | 500 | 410 | 450 | 490 |
| 2013-14 | 830 | 920 | 1,010 | 420 | 465 | 510 | 410 | 455 | 500 |
| 2014-15 | 820 | 900 | 980 | 410 | 450 | 490 | 410 | 450 | 490 |
| 2015-16 | 830 | 920 | 1,010 | 420 | 460 | 500 | 410 | 460 | 510 |
| 2016-17 | 840 | 925 | 1,010 | 420 | 460 | 500 | 420 | 465 | 510 |
| 2017-18 | 860 | 955 | 1,050 | 420 | 470 | 520 | 440 | 485 | 530 |
| 2018-19 | 900 | 995 | 1,090 | 440 | 490 | 540 | 460 | 505 | 550 |
| 2019-20 | 910 | 1,005 | 1,100 | 450 | 495 | 540 | 460 | 510 | 560 |
| 2020-21 | 920 | 1,025 | 1,130 | 450 | 500 | 550 | 470 | 525 | 580 |
| 2021-22 | 950 | 1,040 | 1,130 | 480 | 520 | 560 | 470 | 520 | 570 |
| 2022-23 | 935 | 1,090 | 1,160 | 475 | 550 | 570 | 460 | 540 | 590 |
| Average | 874 | 971 | 1060 | 436 | 483 | 525 | 438 | 488 | 535 |
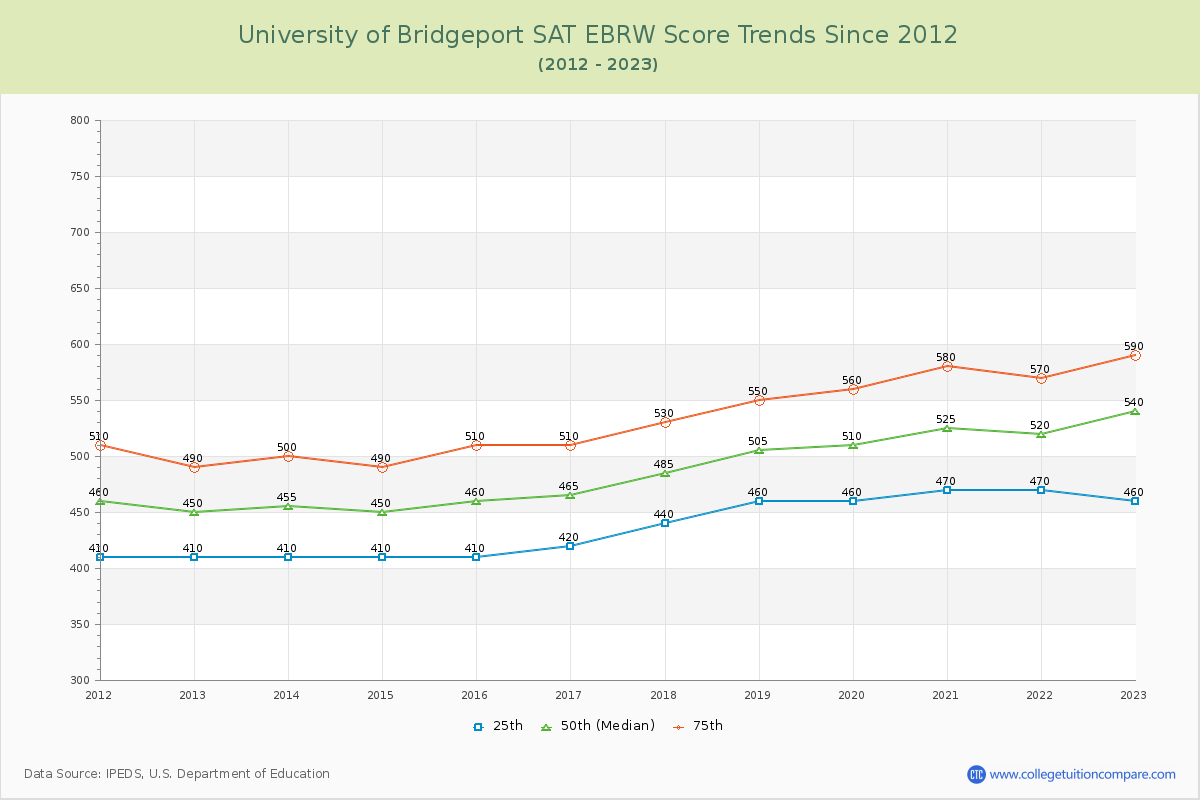
*SAT Evidence-Based Reading and Writing replaces SAT critical reading and writing since year 2017.
**The SAT Writing score is excluded from the total scores for year from 2011 to 2016.