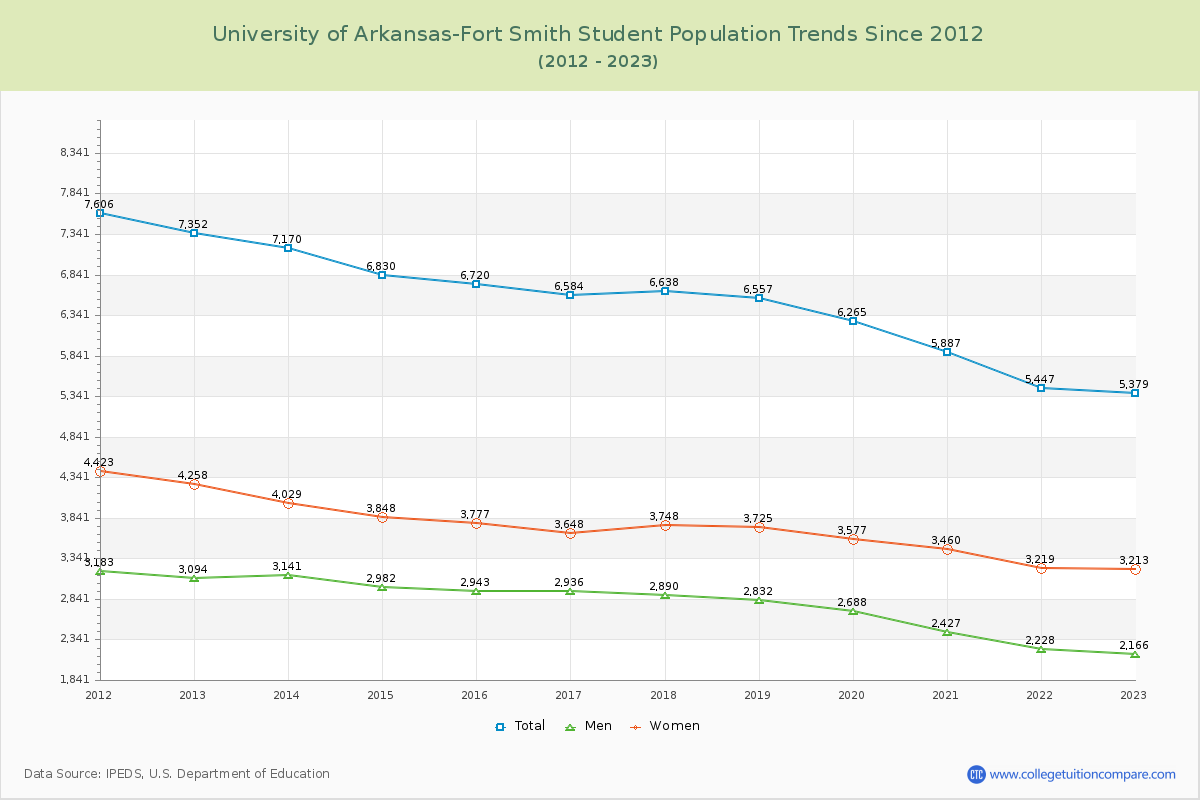
Student Population Changes
The average student population over the last 12 years is 6,439 where 5,379 students are attending the school for the academic year 2022-2023.
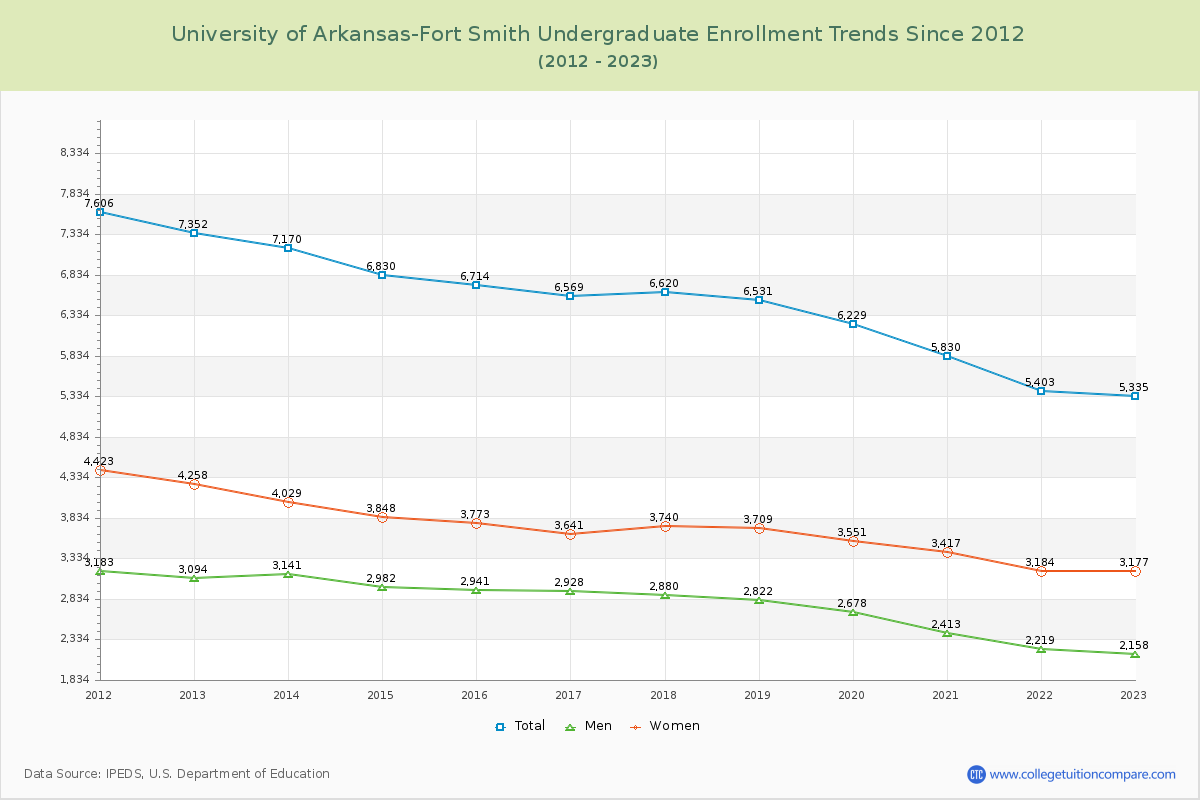
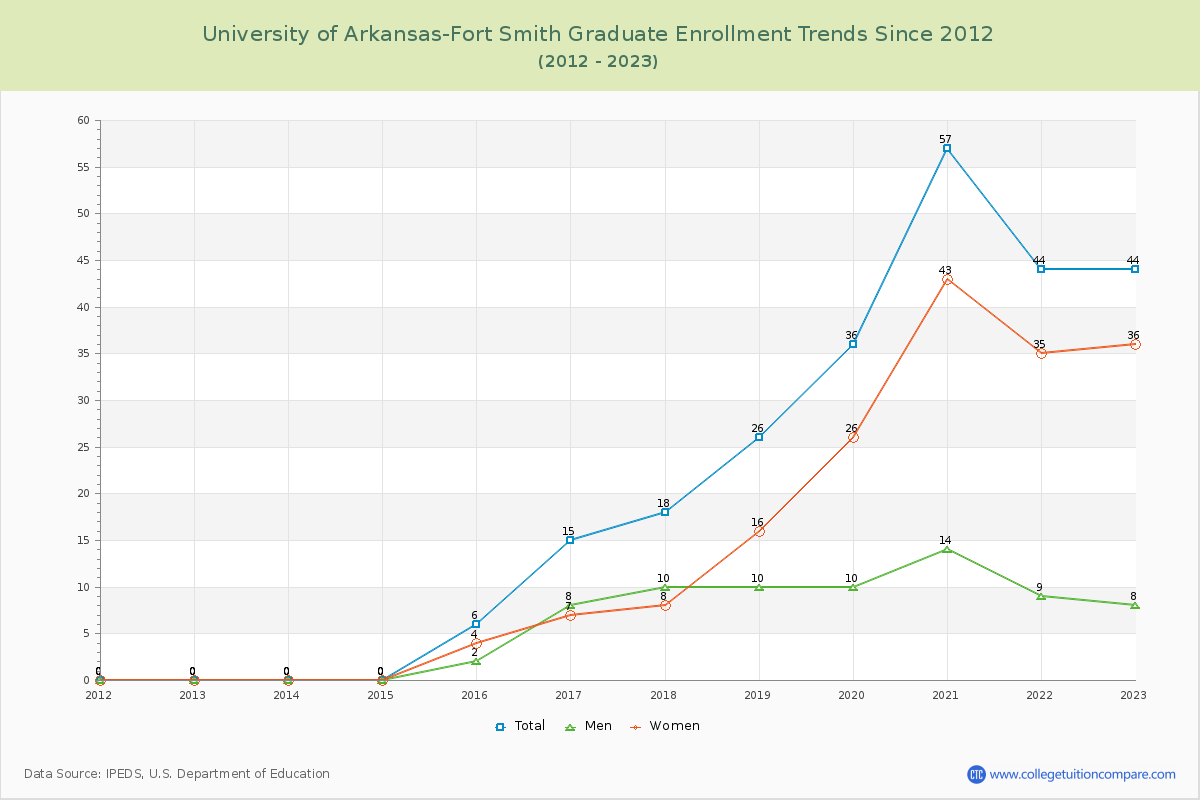
99.18% of total students is undergraduate students and 0.82% students is graduate students. The number of undergraduate students has decreased by 2,017 and the graduate enrollment has increased by 44 over past 10 years.
The female to male ratio is 1.48 to 1 and it means that there are more female students enrolled in UA Fort Smith than male students.
The following table and chart illustrate the changes in student population by gender at University of Arkansas-Fort Smith since 2012.
| Year | Total | Undergraduate | Graduate | ||||
|---|---|---|---|---|---|---|---|
| Total | Men | Women | Total | Men | Women | ||
| 2012-13 | 7,352 | 7,352 | 3,094 | 4,258 | 0 | 0 | 0 |
| 2013-14 | 7,170 -182 | 7,170 -182 | 3,141 47 | 4,029 -229 | 0 0 | 0 0 | 0 0 |
| 2014-15 | 6,830 -340 | 6,830 -340 | 2,982 -159 | 3,848 -181 | 0 0 | 0 0 | 0 0 |
| 2015-16 | 6,720 -110 | 6,714 -116 | 2,941 -41 | 3,773 -75 | 6 6 | 2 2 | 4 4 |
| 2016-17 | 6,584 -136 | 6,569 -145 | 2,928 -13 | 3,641 -132 | 15 9 | 8 6 | 7 3 |
| 2017-18 | 6,638 54 | 6,620 51 | 2,880 -48 | 3,740 99 | 18 3 | 10 2 | 8 1 |
| 2018-19 | 6,557 -81 | 6,531 -89 | 2,822 -58 | 3,709 -31 | 26 8 | 10 0 | 16 8 |
| 2019-20 | 6,265 -292 | 6,229 -302 | 2,678 -144 | 3,551 -158 | 36 10 | 10 0 | 26 10 |
| 2020-21 | 5,887 -378 | 5,830 -399 | 2,413 -265 | 3,417 -134 | 57 21 | 14 4 | 43 17 |
| 2021-22 | 5,447 -440 | 5,403 -427 | 2,219 -194 | 3,184 -233 | 44 -13 | 9 -5 | 35 -8 |
| 2022-23 | 5,379 -68 | 5,335 -68 | 2,158 -61 | 3,177 -7 | 44 0 | 8 -1 | 36 1 |
| Average | 6,439 | 6,417 | 2,751 | 3,666 | 22 | 6 | 16 |