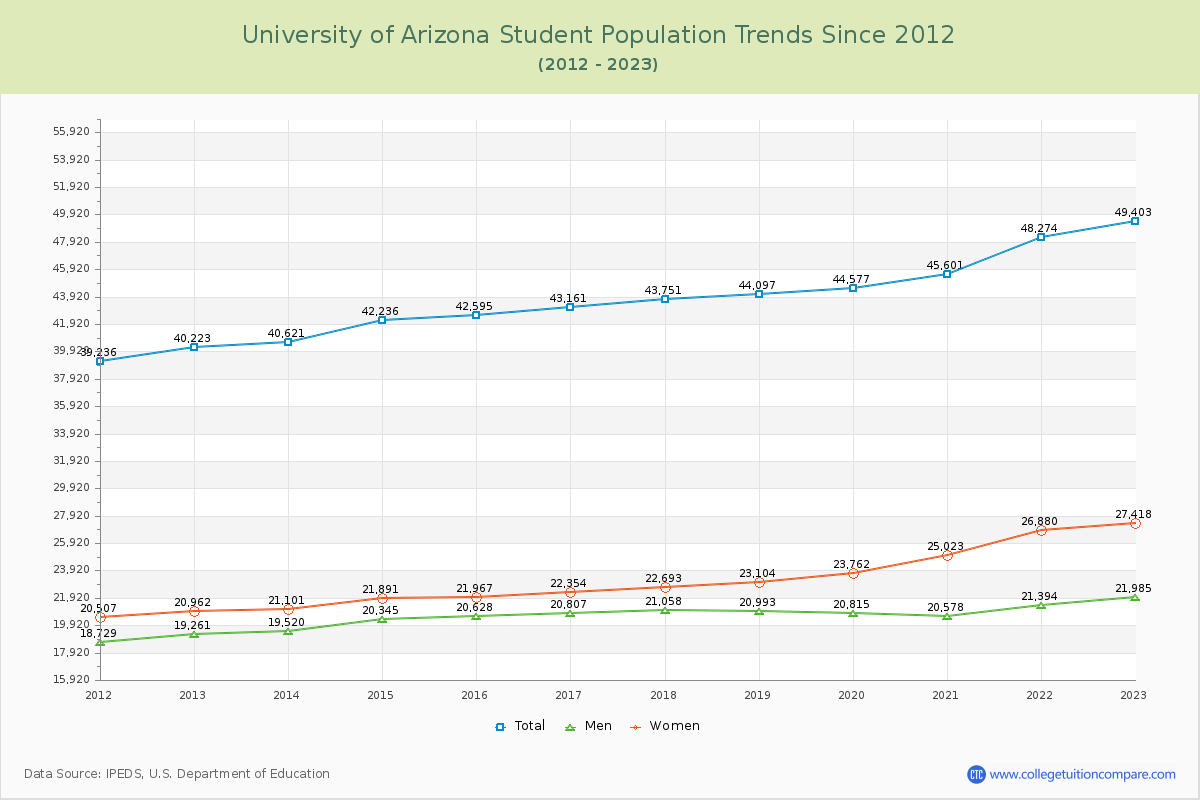
Student Population Changes
The average student population over the last 12 years is 44,049 where 49,403 students are attending the school for the academic year 2022-2023.
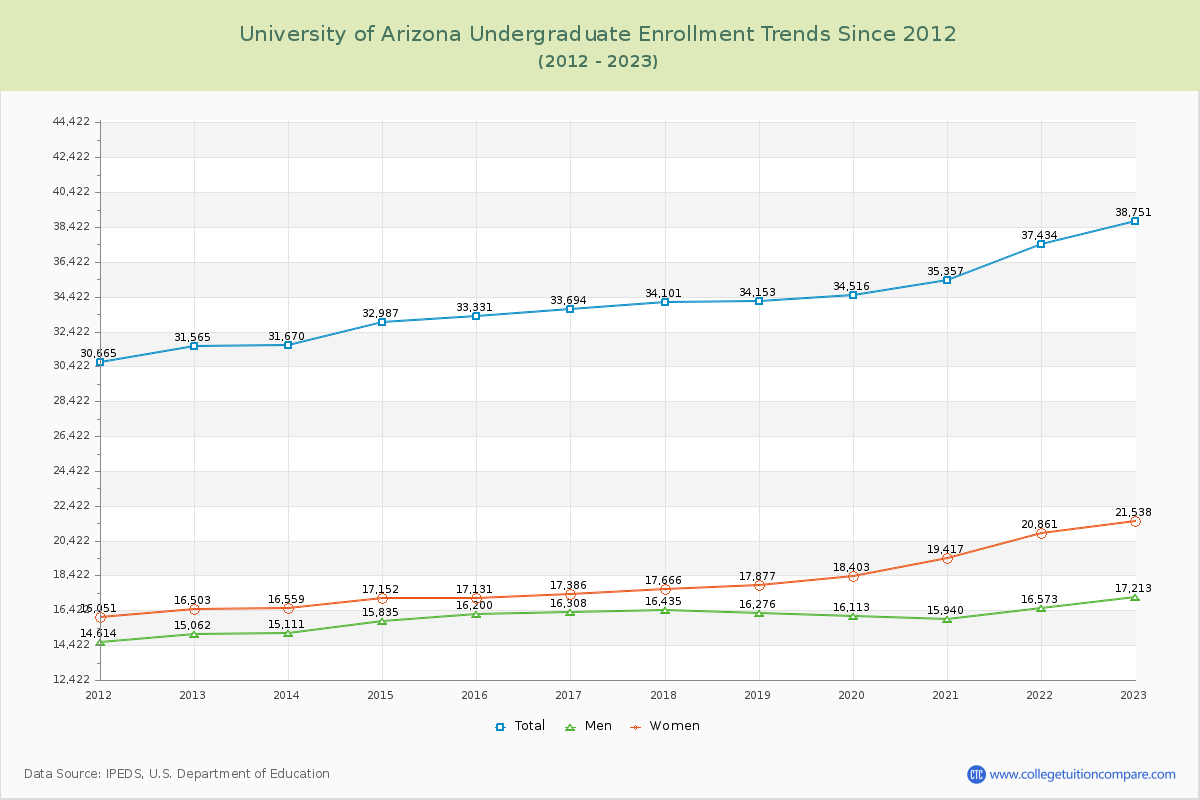
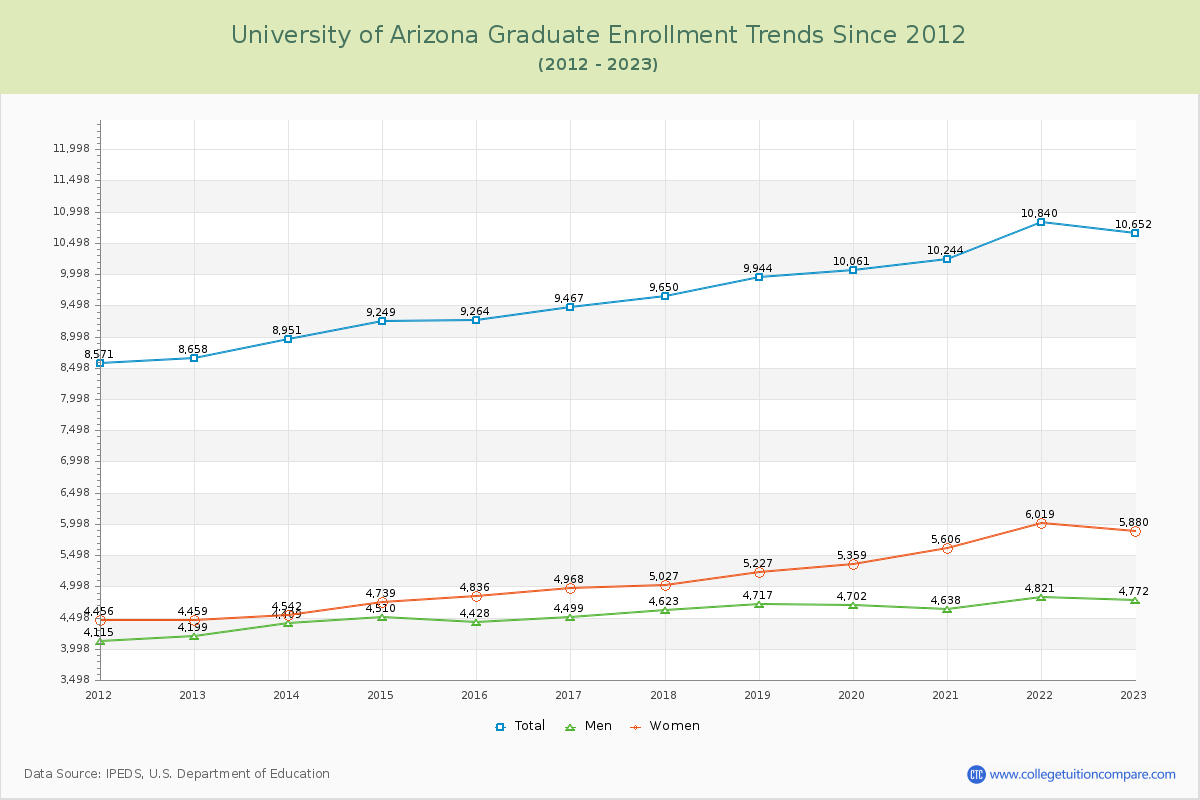
78.44% of total students is undergraduate students and 21.56% students is graduate students. The number of undergraduate students has increased by 7,186 and the graduate enrollment has increased by 1,994 over past 10 years.
The female to male ratio is 1.25 to 1 and it means that there are slightly more female students enrolled in Arizona than male students.
The following table and chart illustrate the changes in student population by gender at University of Arizona since 2012.
| Year | Total | Undergraduate | Graduate | ||||
|---|---|---|---|---|---|---|---|
| Total | Men | Women | Total | Men | Women | ||
| 2012-13 | 40,223 | 31,565 | 15,062 | 16,503 | 8,658 | 4,199 | 4,459 |
| 2013-14 | 40,621 398 | 31,670 105 | 15,111 49 | 16,559 56 | 8,951 293 | 4,409 210 | 4,542 83 |
| 2014-15 | 42,236 1,615 | 32,987 1,317 | 15,835 724 | 17,152 593 | 9,249 298 | 4,510 101 | 4,739 197 |
| 2015-16 | 42,595 359 | 33,331 344 | 16,200 365 | 17,131 -21 | 9,264 15 | 4,428 -82 | 4,836 97 |
| 2016-17 | 43,161 566 | 33,694 363 | 16,308 108 | 17,386 255 | 9,467 203 | 4,499 71 | 4,968 132 |
| 2017-18 | 43,751 590 | 34,101 407 | 16,435 127 | 17,666 280 | 9,650 183 | 4,623 124 | 5,027 59 |
| 2018-19 | 44,097 346 | 34,153 52 | 16,276 -159 | 17,877 211 | 9,944 294 | 4,717 94 | 5,227 200 |
| 2019-20 | 44,577 480 | 34,516 363 | 16,113 -163 | 18,403 526 | 10,061 117 | 4,702 -15 | 5,359 132 |
| 2020-21 | 45,601 1,024 | 35,357 841 | 15,940 -173 | 19,417 1,014 | 10,244 183 | 4,638 -64 | 5,606 247 |
| 2021-22 | 48,274 2,673 | 37,434 2,077 | 16,573 633 | 20,861 1,444 | 10,840 596 | 4,821 183 | 6,019 413 |
| 2022-23 | 49,403 1,129 | 38,751 1,317 | 17,213 640 | 21,538 677 | 10,652 -188 | 4,772 -49 | 5,880 -139 |
| Average | 44,049 | 34,324 | 16,097 | 18,227 | 9,725 | 4,574 | 5,151 |