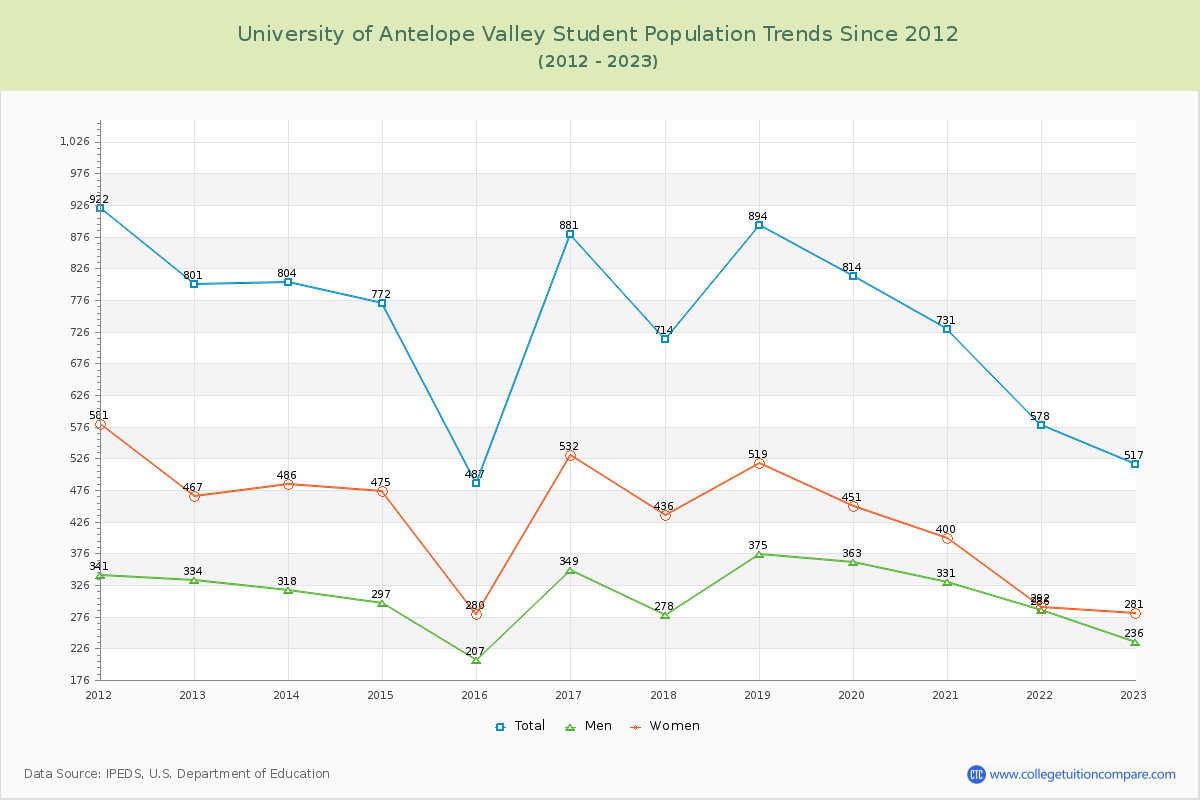
Student Population Changes
The average student population over the last 12 years is 727 where 517 students are attending the school for the academic year 2022-2023.
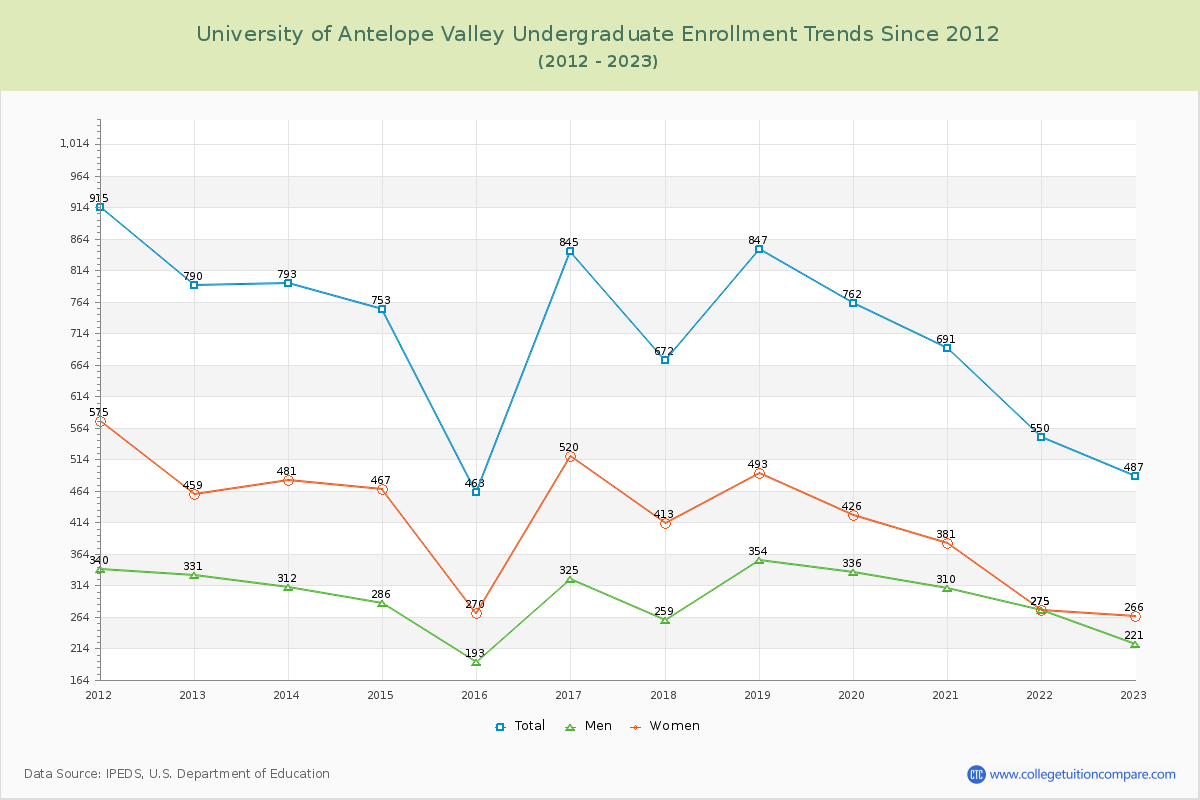
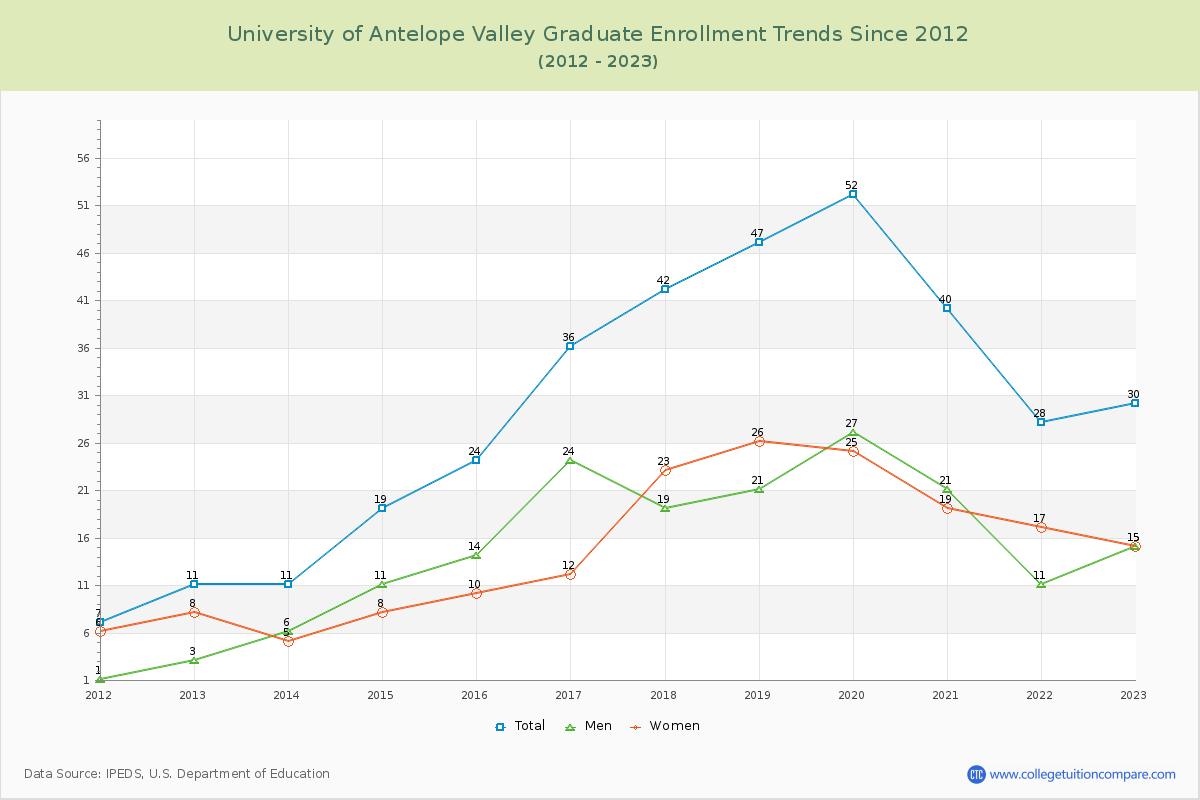
94.20% of total students is undergraduate students and 5.80% students is graduate students. The number of undergraduate students has decreased by 303 and the graduate enrollment has increased by 19 over past 10 years.
The female to male ratio is 1.19 to 1 and it means that there are slightly more female students enrolled in UAV than male students.
The following table and chart illustrate the changes in student population by gender at University of Antelope Valley since 2012.
| Year | Total | Undergraduate | Graduate | ||||
|---|---|---|---|---|---|---|---|
| Total | Men | Women | Total | Men | Women | ||
| 2012-13 | 801 | 790 | 331 | 459 | 11 | 3 | 8 |
| 2013-14 | 804 3 | 793 3 | 312 -19 | 481 22 | 11 0 | 6 3 | 5 -3 |
| 2014-15 | 772 -32 | 753 -40 | 286 -26 | 467 -14 | 19 8 | 11 5 | 8 3 |
| 2015-16 | 487 -285 | 463 -290 | 193 -93 | 270 -197 | 24 5 | 14 3 | 10 2 |
| 2016-17 | 881 394 | 845 382 | 325 132 | 520 250 | 36 12 | 24 10 | 12 2 |
| 2017-18 | 714 -167 | 672 -173 | 259 -66 | 413 -107 | 42 6 | 19 -5 | 23 11 |
| 2018-19 | 894 180 | 847 175 | 354 95 | 493 80 | 47 5 | 21 2 | 26 3 |
| 2019-20 | 814 -80 | 762 -85 | 336 -18 | 426 -67 | 52 5 | 27 6 | 25 -1 |
| 2020-21 | 731 -83 | 691 -71 | 310 -26 | 381 -45 | 40 -12 | 21 -6 | 19 -6 |
| 2021-22 | 578 -153 | 550 -141 | 275 -35 | 275 -106 | 28 -12 | 11 -10 | 17 -2 |
| 2022-23 | 517 -61 | 487 -63 | 221 -54 | 266 -9 | 30 2 | 15 4 | 15 -2 |
| Average | 727 | 696 | 291 | 405 | 31 | 16 | 15 |