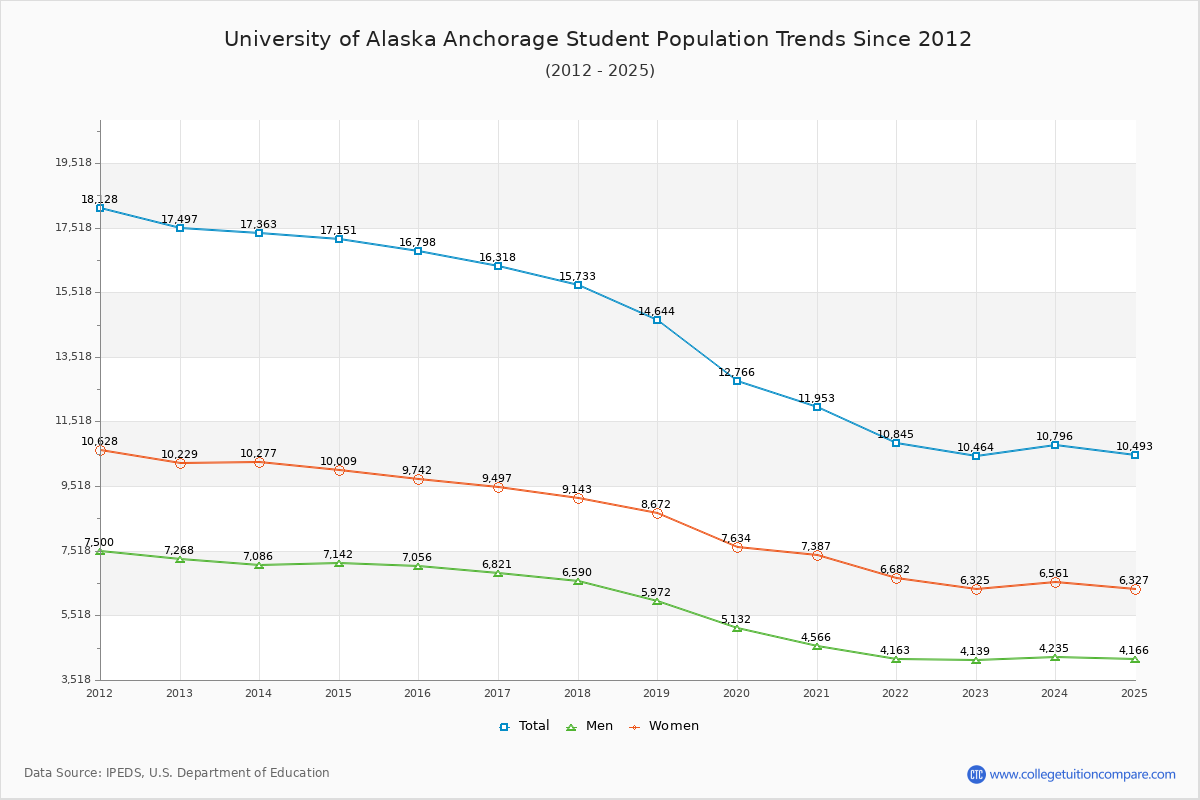
Student Population Changes
The average student population over the last 12 years is 14,685 where 10,464 students are attending the school for the academic year 2022-2023.
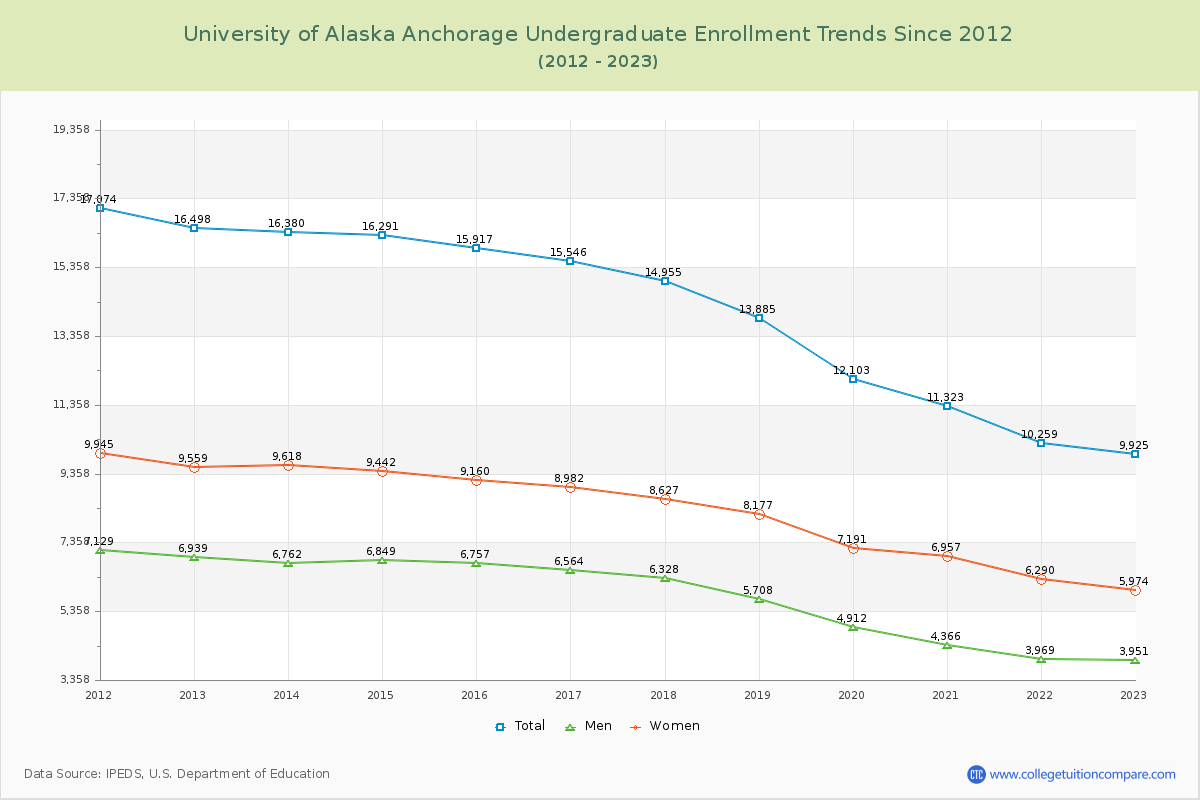
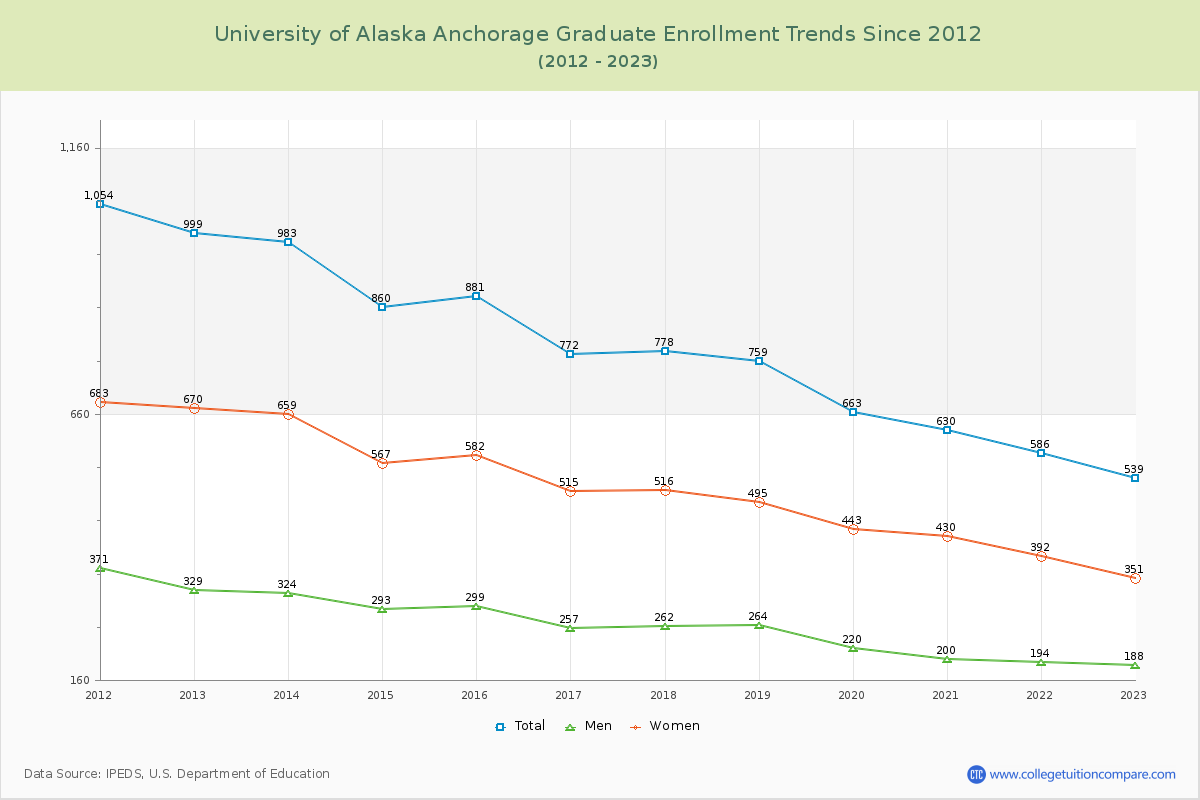
94.85% of total students is undergraduate students and 5.15% students is graduate students. The number of undergraduate students has decreased by 6,573 and the graduate enrollment has decreased by 460 over past 10 years.
The female to male ratio is 1.53 to 1 and it means that there are more female students enrolled in UAA than male students.
The following table and chart illustrate the changes in student population by gender at University of Alaska Anchorage since 2012.
| Year | Total | Undergraduate | Graduate | ||||
|---|---|---|---|---|---|---|---|
| Total | Men | Women | Total | Men | Women | ||
| 2012-13 | 17,497 | 16,498 | 6,939 | 9,559 | 999 | 329 | 670 |
| 2013-14 | 17,363 -134 | 16,380 -118 | 6,762 -177 | 9,618 59 | 983 -16 | 324 -5 | 659 -11 |
| 2014-15 | 17,151 -212 | 16,291 -89 | 6,849 87 | 9,442 -176 | 860 -123 | 293 -31 | 567 -92 |
| 2015-16 | 16,798 -353 | 15,917 -374 | 6,757 -92 | 9,160 -282 | 881 21 | 299 6 | 582 15 |
| 2016-17 | 16,318 -480 | 15,546 -371 | 6,564 -193 | 8,982 -178 | 772 -109 | 257 -42 | 515 -67 |
| 2017-18 | 15,733 -585 | 14,955 -591 | 6,328 -236 | 8,627 -355 | 778 6 | 262 5 | 516 1 |
| 2018-19 | 14,644 -1,089 | 13,885 -1,070 | 5,708 -620 | 8,177 -450 | 759 -19 | 264 2 | 495 -21 |
| 2019-20 | 12,766 -1,878 | 12,103 -1,782 | 4,912 -796 | 7,191 -986 | 663 -96 | 220 -44 | 443 -52 |
| 2020-21 | 11,953 -813 | 11,323 -780 | 4,366 -546 | 6,957 -234 | 630 -33 | 200 -20 | 430 -13 |
| 2021-22 | 10,845 -1,108 | 10,259 -1,064 | 3,969 -397 | 6,290 -667 | 586 -44 | 194 -6 | 392 -38 |
| 2022-23 | 10,464 -381 | 9,925 -334 | 3,951 -18 | 5,974 -316 | 539 -47 | 188 -6 | 351 -41 |
| Average | 14,685 | 13,917 | 5,737 | 8,180 | 768 | 257 | 511 |