Enrollment Trends at UCC

111

Total Enrollment

18

Men

93

Women

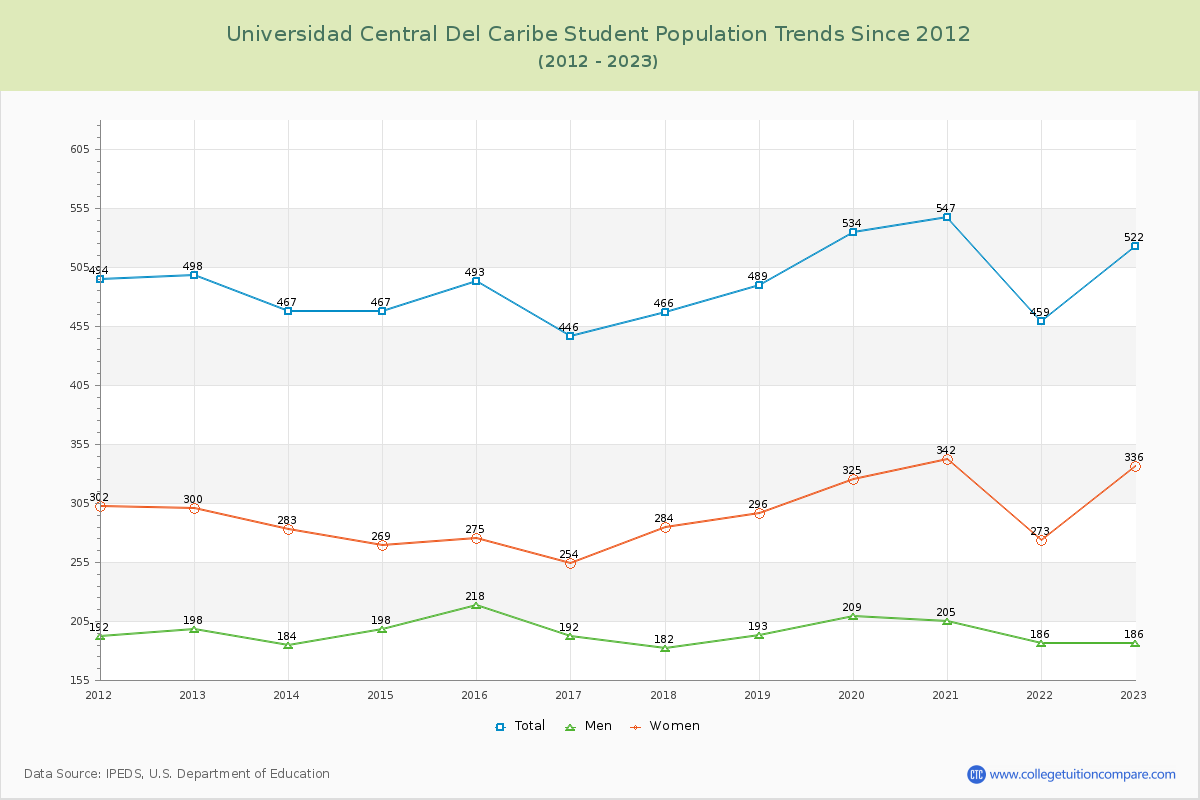
The student population at Universidad Central Del Caribe is 604 (90 undergraduate and 514 graduate students) . The number of students has increased by 111 over the past decade.

The percentage of undergraduate students at UCC is 14.90% which is decreased by 61 over last 10 years. The graduate student population increased by 172 and it has been increasing.

The female to male ratio is 1.56 to 1 which means that female students enrolled more than male students.

4 students enrolled in online degree program exclusively and the number of online students has decreased by % since 2015.

Student Population Changes

The average student population over the last 11 years is 512 where 604 students are attending the school for the academic year 2024-2025.

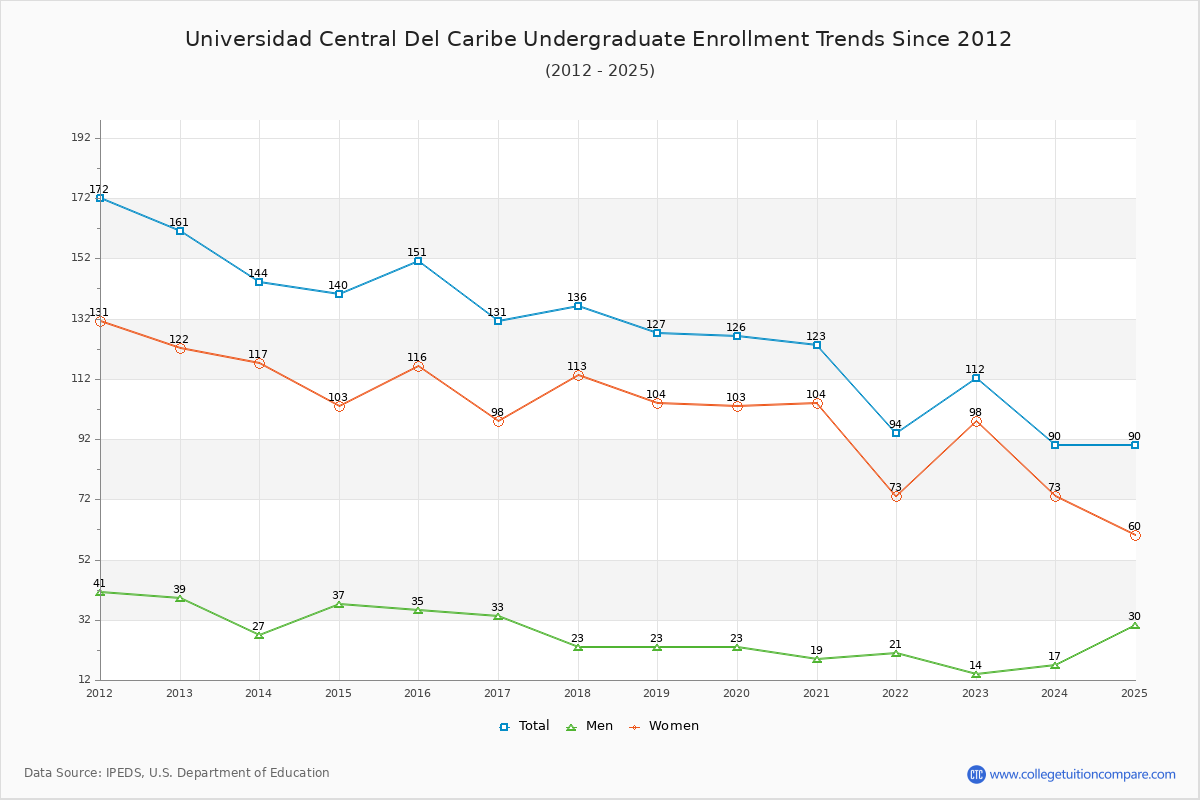
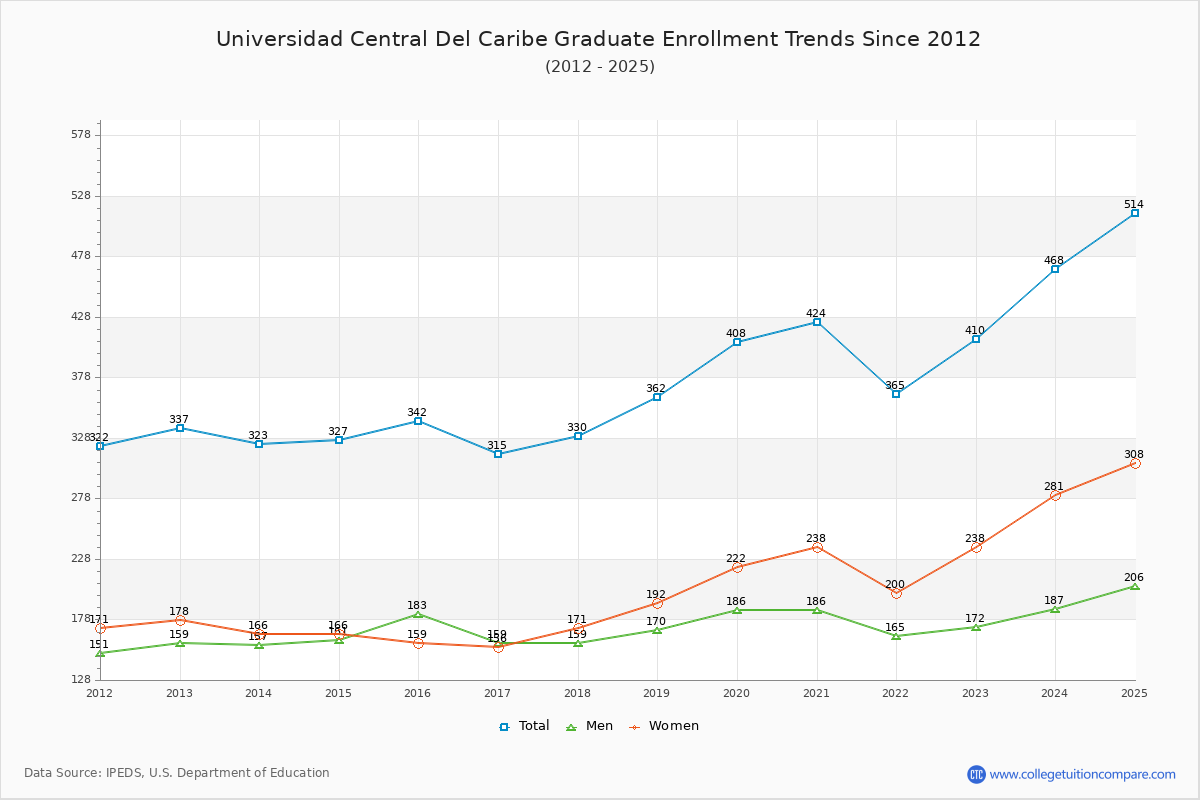
14.90% of total students is undergraduate students and 85.10% students is graduate students. The number of undergraduate students has decreased by 61 and the graduate enrollment has increased by 172 over past 10 years.

The female to male ratio is 1.56 to 1 and it means that there are more female students enrolled in UCC than male students.

The following table and chart illustrate the changes in student population by gender at Universidad Central Del Caribe since 2015.

YearTotalUndergraduateGraduate
TotalMenWomenTotalMenWomen
2015-1649315135116342183159
2016-17446
-47
131
-20
33
-2
98
-18
315
-27
159
-24
156
-3
2017-18466
20
136
5
23
-10
113
15
330
15
159171
15
2018-19489
23
127
-9
23104
-9
362
32
170
11
192
21
2019-20534
45
126
-1
23103
-1
408
46
186
16
222
30
2020-21547
13
123
-3
19
-4
104
1
424
16
186238
16
2021-22459
-88
94
-29
21
2
73
-31
365
-59
165
-21
200
-38
2022-23522
63
112
18
14
-7
98
25
410
45
172
7
238
38
2023-24558
36
90
-22
17
3
73
-25
468
58
187
15
281
43
2024-25604
46
9030
13
60
-13
514
46
206
19
308
27
Average5121182494394177217
Universidad Central Del Caribe Enrollment Trends Chart

Undergraduate Enrollment Changes

The average number of Undergraduate students over the last 11 years is 118 where 90 students are attending the Undergraduate school for the academic year 2024-2025. The following table and chart illustrate the changes in Undergraduate enrollment by attending status and gender at Universidad Central Del Caribe since 2015.

YearTotalFull-timePart-time
TotalMenWomenTotalMenWomen
2015-16151125289726719
2016-171311042381271017
2017-1813698197938434
2018-1912795158032824
2019-20126105218421219
2020-21123108159315411
2021-229476175918414
2022-231128687826620
2023-249077166113112
2024-25907826521248
Average1181181976118518
Universidad Central Del Caribe Undergraduate Enrollment Trends Chart

Graduate Enrollment Changes

The average number of Graduate students over the last 11 years is 394 where 514 students are attending the Graduate school for the academic year 2024-2025. The following table and chart illustrate the changes in Graduate enrollment by attending status and gender at Universidad Central Del Caribe since 2015.

YearTotalMenWomen
2015-16342342183159000
2016-17315315159156000
2017-18330330159171000
2018-19362362170192000
2019-20408408186222000
2020-21424424186238000
2021-22365365165200000
2022-23410410172238000
2023-24468468187281000
2024-25514514206308000
Average39439417721739400
Universidad Central Del Caribe Graduate Enrollment Trends Chart

Enrollment by Race/Ethnicity Changes

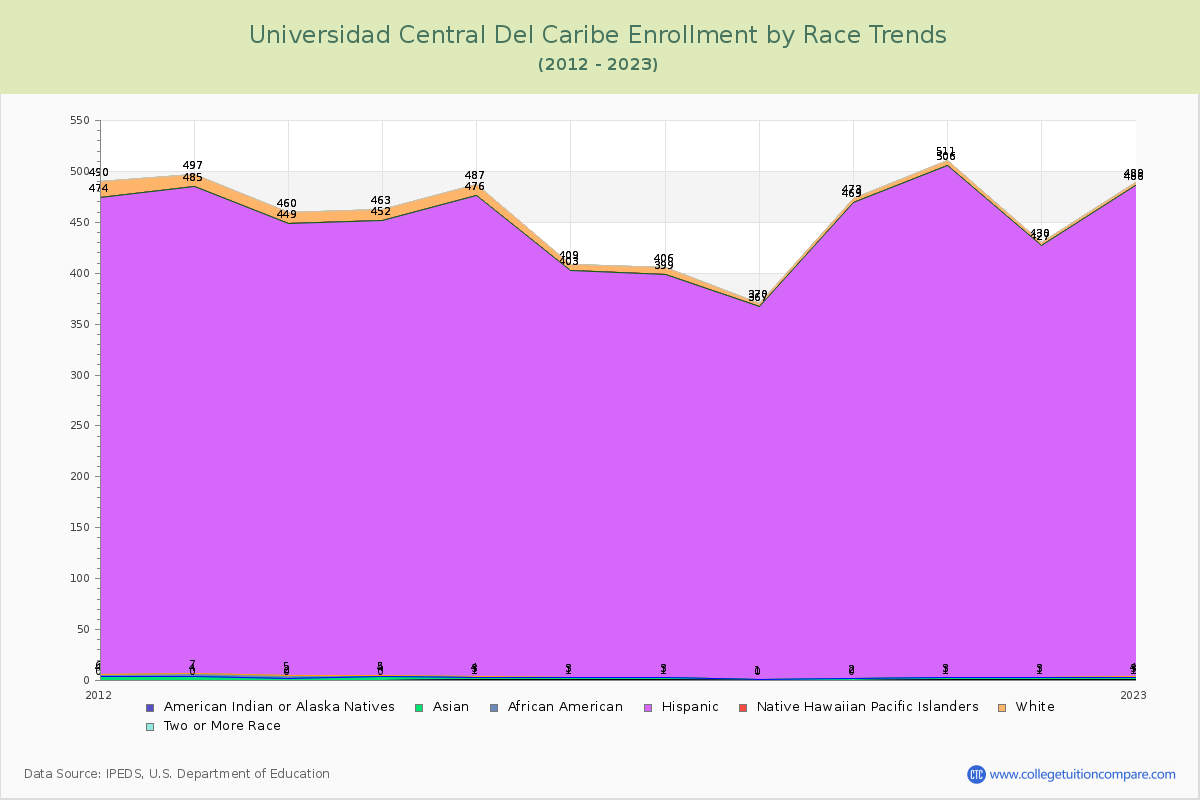
The percentage of white students is 0.83% and the percentage of black students is 0.50% at Universidad Central Del Caribe. 0.33% of enrolled students is Asian. Hispanic students comprise 94.21% of the student body.

Over the past 10 years, the racial composition has shifted. The percentage of white students decreased from 2.23% to 0.83%. Asian enrollment declined from 0.41% to 0.33%. Black student enrollment increased from 0.20% to 0.50%. Hispanic student representation contracted from 95.74% to 94.21%.

The overall racial diversity, measured by the Census Bureau Diversity Index, is 0.1124 which indicates that not very diverse. This increased from 0.0829 a decade ago, suggesting that racial diversity has improved.

The following table and chart illustrate the student population trends by race/ethnicity at Universidad Central Del Caribe over the past 11 years (2015-2025).

YearAmerican Indian or Native AmericanAsianBlackHispanicNative Hawaiian or Other Pacific IslanderWhiteTwo or More Races
2015-161214720110
2016-17120400060
2017-18120396070
2018-19010366030
2019-20020467040
2020-21120503050
2021-22120424030
2022-23121482030
2023-24514518050
2024-25323569050
Average121460050
Universidad Central Del Caribe Enrollment by Race Trends Chart

Distance Learning (Online Courses) Enrollment Changes

4 students are enrolled in online degree programs exclusively for the academic year 2024-2025, which is 1% of total students. The number of online students has decreased % since 2015. The following table and chart illustrate the changes in the online student population by enrolled type at Universidad Central Del Caribe from 2015 to 2025.

YearTotal EnrollmentOnline CompletelyEnrolled in Some Online CoursesNot Enrolled in Online Courses
2015-1649300493
2016-1744600446
2017-1846600466
2018-1948900489
2019-2053400534
2020-2154705470
2021-22459044118
2022-23522125100
2023-2455895490
2024-2560440600
Average5123205305

Ratings & Review

Share your experiences and thoughts about Universidad Central Del Caribe. It will be a great help to applicants and prospective students!