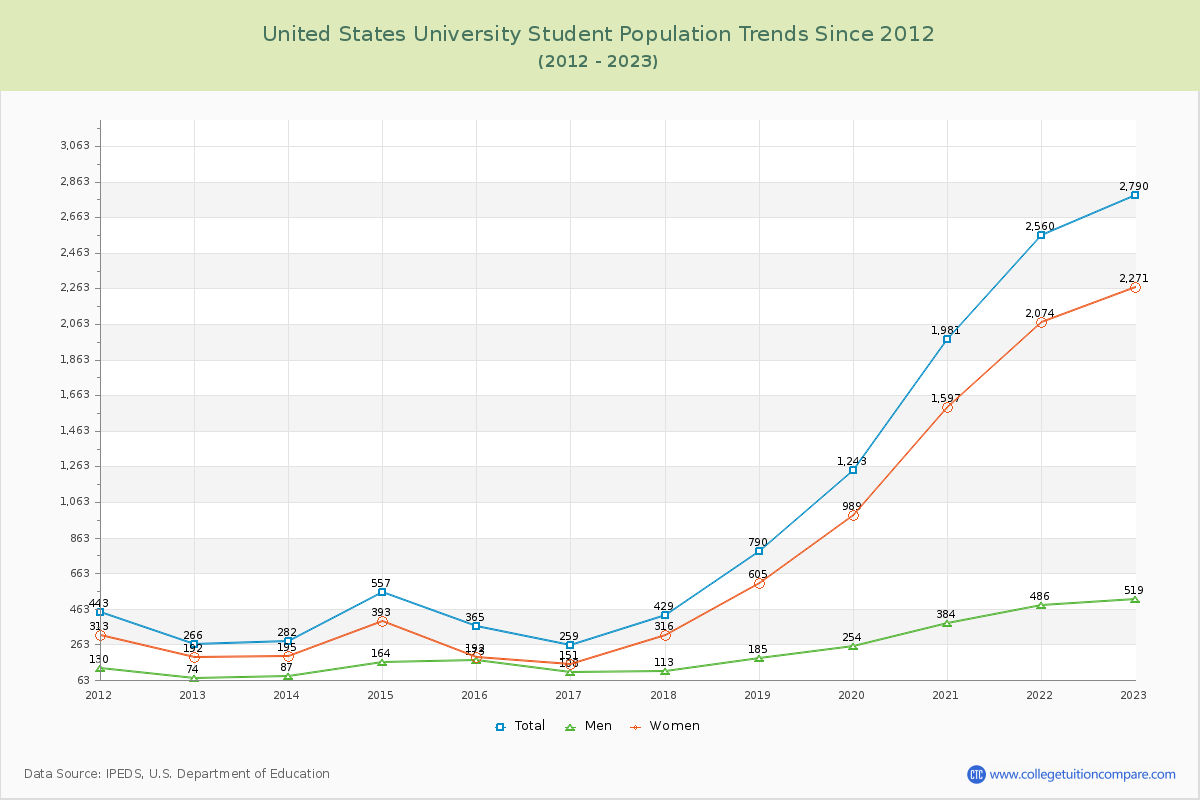
Student Population Changes
The average student population over the last 12 years is 1,047 where 2,790 students are attending the school for the academic year 2022-2023.
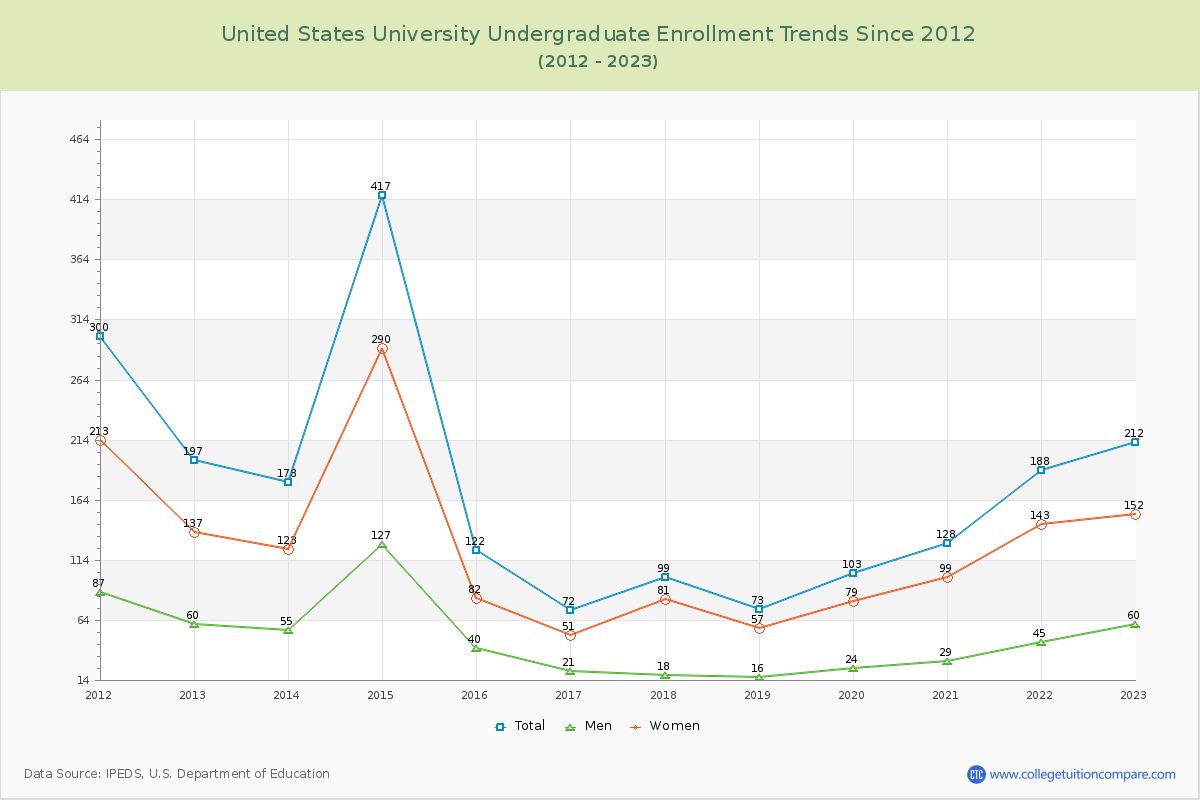
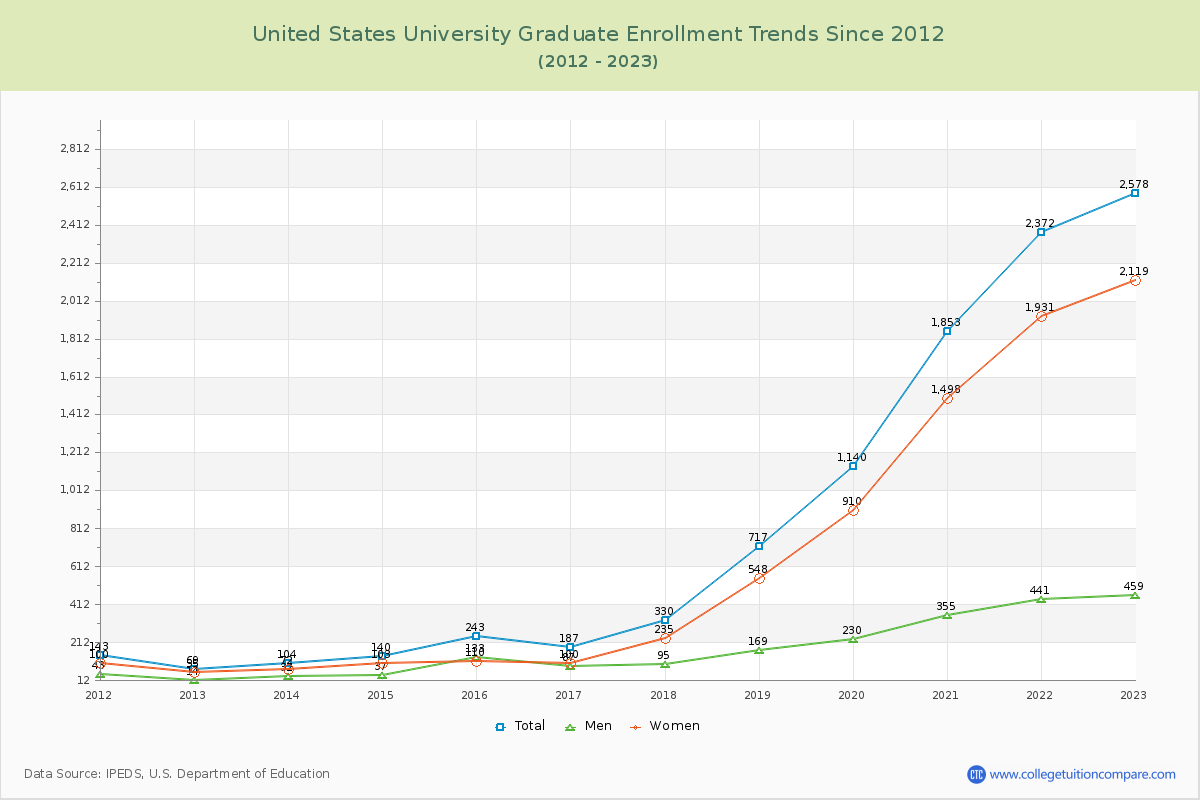
7.60% of total students is undergraduate students and 92.40% students is graduate students. The number of undergraduate students has increased by 15 and the graduate enrollment has increased by 2,509 over past 10 years.
The female to male ratio is 4.38 to 1 and it means that there are far more female students enrolled in USU than male students.
The following table and chart illustrate the changes in student population by gender at United States University since 2012.
| Year | Total | Undergraduate | Graduate | ||||
|---|---|---|---|---|---|---|---|
| Total | Men | Women | Total | Men | Women | ||
| 2012-13 | 266 | 197 | 60 | 137 | 69 | 14 | 55 |
| 2013-14 | 282 16 | 178 -19 | 55 -5 | 123 -14 | 104 35 | 32 18 | 72 17 |
| 2014-15 | 557 275 | 417 239 | 127 72 | 290 167 | 140 36 | 37 5 | 103 31 |
| 2015-16 | 365 -192 | 122 -295 | 40 -87 | 82 -208 | 243 103 | 133 96 | 110 7 |
| 2016-17 | 259 -106 | 72 -50 | 21 -19 | 51 -31 | 187 -56 | 87 -46 | 100 -10 |
| 2017-18 | 429 170 | 99 27 | 18 -3 | 81 30 | 330 143 | 95 8 | 235 135 |
| 2018-19 | 790 361 | 73 -26 | 16 -2 | 57 -24 | 717 387 | 169 74 | 548 313 |
| 2019-20 | 1,243 453 | 103 30 | 24 8 | 79 22 | 1,140 423 | 230 61 | 910 362 |
| 2020-21 | 1,981 738 | 128 25 | 29 5 | 99 20 | 1,853 713 | 355 125 | 1,498 588 |
| 2021-22 | 2,560 579 | 188 60 | 45 16 | 143 44 | 2,372 519 | 441 86 | 1,931 433 |
| 2022-23 | 2,790 230 | 212 24 | 60 15 | 152 9 | 2,578 206 | 459 18 | 2,119 188 |
| Average | 1,047 | 163 | 45 | 118 | 885 | 187 | 698 |