Enrollment Trends at United States Sports

48

Total Enrollment

26

Men

22

Women

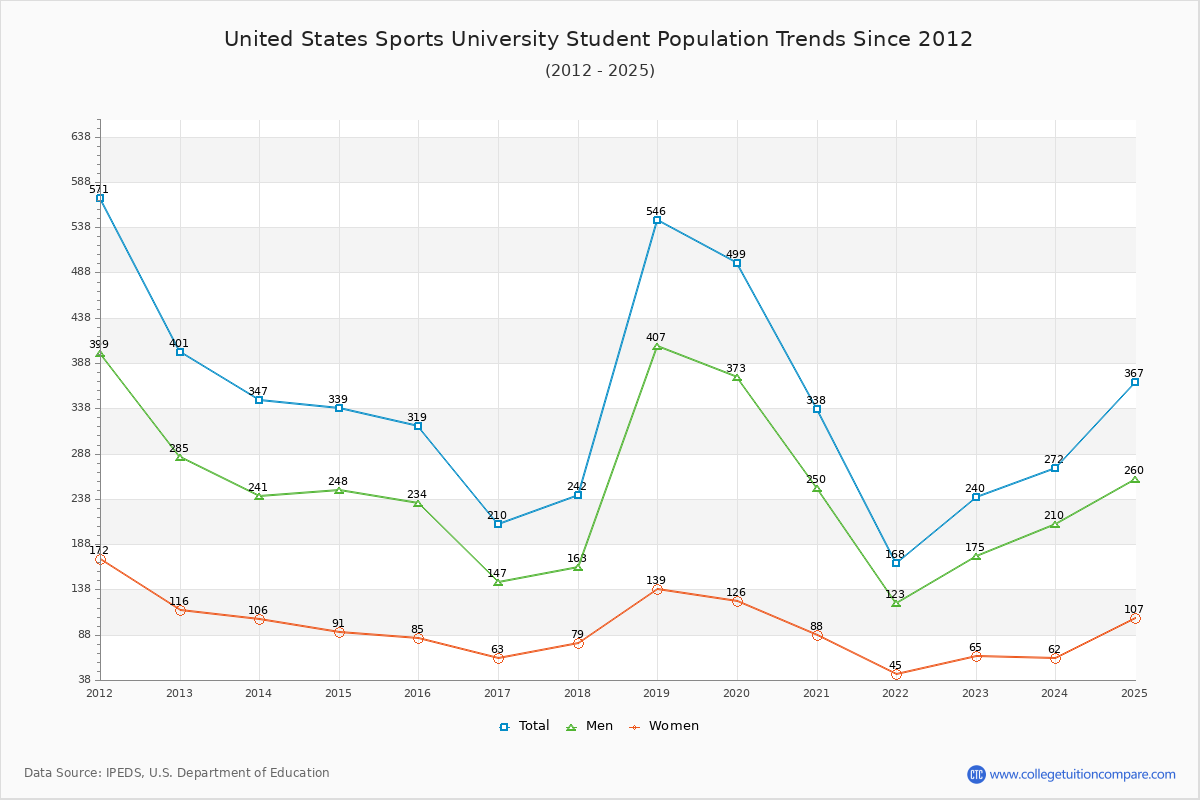
The student population at United States Sports University is 367 (234 undergraduate and 133 graduate students) . The number of students has increased by 48 over the past decade.

The percentage of undergraduate students at United States Sports is 63.76% which is increased by 105 over last 10 years. The graduate student population decreased by 57 and it has been decreasing.

The female to male ratio is 0.41 to 1 which means that majority of population is on male students.

267 students enrolled in online degree program exclusively and the number of online students has decreased by -14.97% since 2015.

Student Population Changes

The average student population over the last 11 years is 320 where 367 students are attending the school for the academic year 2024-2025.

63.76% of total students is undergraduate students and 36.24% students is graduate students. The number of undergraduate students has increased by 105 and the graduate enrollment has decreased by 57 over past 10 years.

The female to male ratio is 0.41 to 1 and it means that there are far more male students enrolled in United States Sports than female students.

The following table and chart illustrate the changes in student population by gender at United States Sports University since 2015.

YearTotalUndergraduateGraduate
TotalMenWomenTotalMenWomen
2015-163191291062319012862
2016-17210
-109
75
-54
62
-44
13
-10
135
-55
85
-43
50
-12
2017-18242
32
103
28
74
12
29
16
139
4
89
4
50
2018-19546
304
305
202
243
169
62
33
241
102
164
75
77
27
2019-20499
-47
232
-73
182
-61
50
-12
267
26
191
27
76
-1
2020-21338
-161
137
-95
108
-74
29
-21
201
-66
142
-49
59
-17
2021-22168
-170
71
-66
52
-56
19
-10
97
-104
71
-71
26
-33
2022-23240
72
108
37
85
33
23
4
132
35
90
19
42
16
2023-24272
32
144
36
124
39
20
-3
128
-4
86
-4
42
2024-25367
95
234
90
167
43
67
47
133
5
93
7
40
-2
Average3201541203416611452
United States Sports University Enrollment Trends Chart

Undergraduate Enrollment Changes

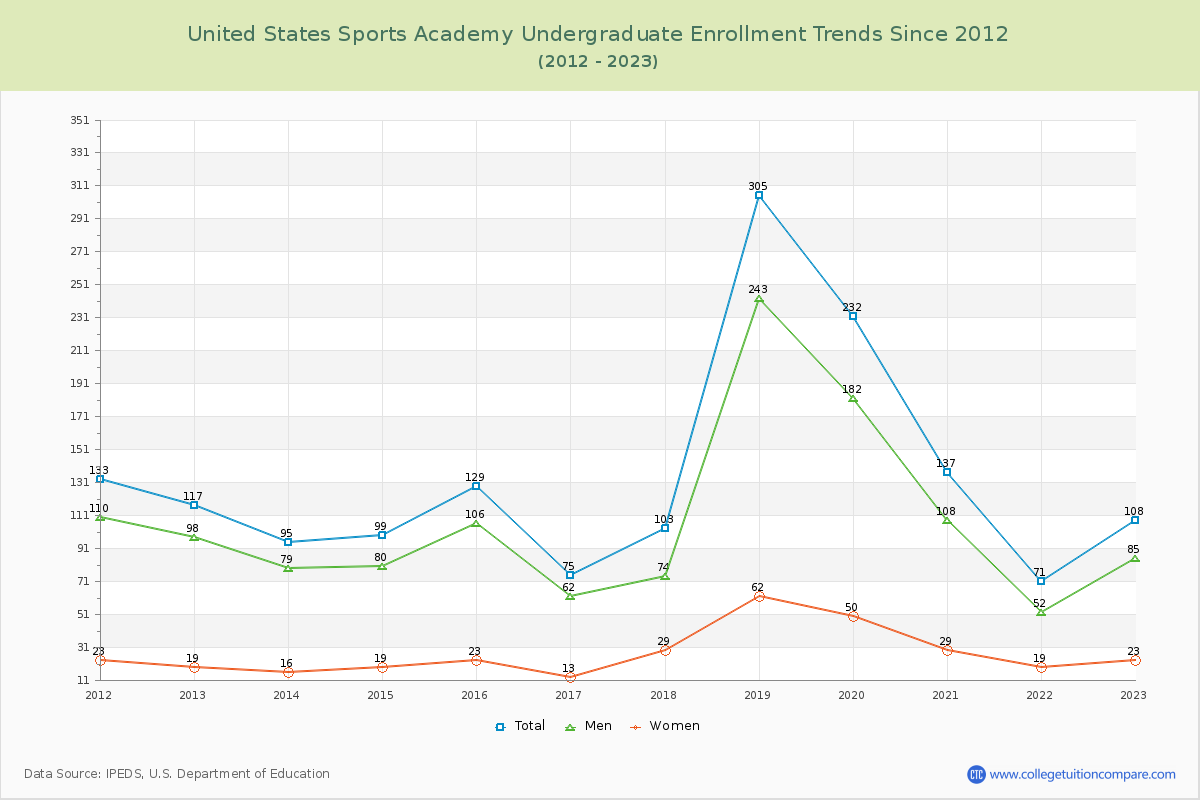
The average number of Undergraduate students over the last 11 years is 154 where 234 students are attending the Undergraduate school for the academic year 2024-2025. The following table and chart illustrate the changes in Undergraduate enrollment by attending status and gender at United States Sports University since 2015.

YearTotalFull-timePart-time
TotalMenWomenTotalMenWomen
2015-16129191541109119
2016-177512102635211
2017-1810315132886127
2018-193058678821916554
2019-202323432219815048
2020-21137312561068323
2021-227114113574116
2022-23108241410847113
2023-241442421312010317
2024-2523417412747604020
Average1541543591548625
United States Sports University Undergraduate Enrollment Trends Chart

Graduate Enrollment Changes

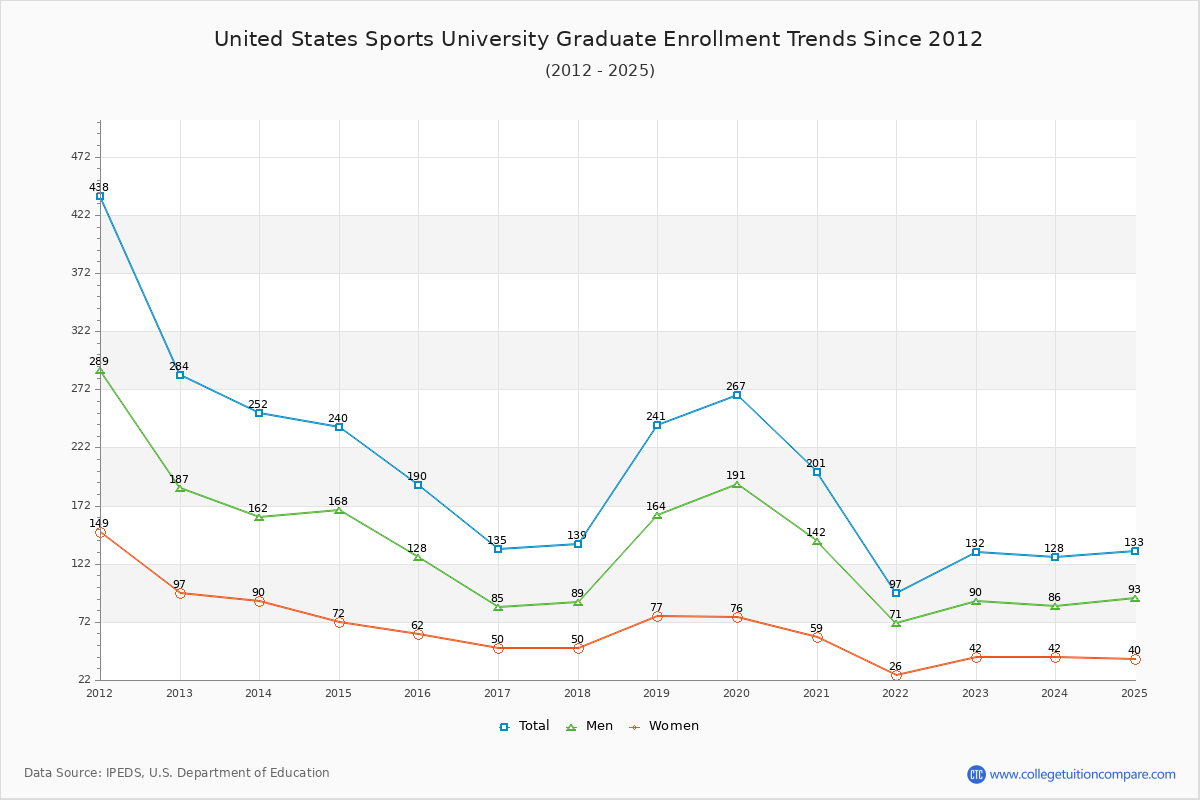
The average number of Graduate students over the last 11 years is 166 where 133 students are attending the Graduate school for the academic year 2024-2025. The following table and chart illustrate the changes in Graduate enrollment by attending status and gender at United States Sports University since 2015.

YearTotalFull-timePart-time
TotalMenWomenTotalMenWomen
2015-161905540151358847
2016-17135362313996237
2017-18139433013965937
2018-192418869191539558
2019-2026795653017212646
2020-212011057728966531
2021-2297332310644816
2022-2313235278976334
2023-24128493316795326
2024-25133432518906822
Average16616641171667335
United States Sports University Graduate Enrollment Trends Chart

Enrollment by Race/Ethnicity Changes

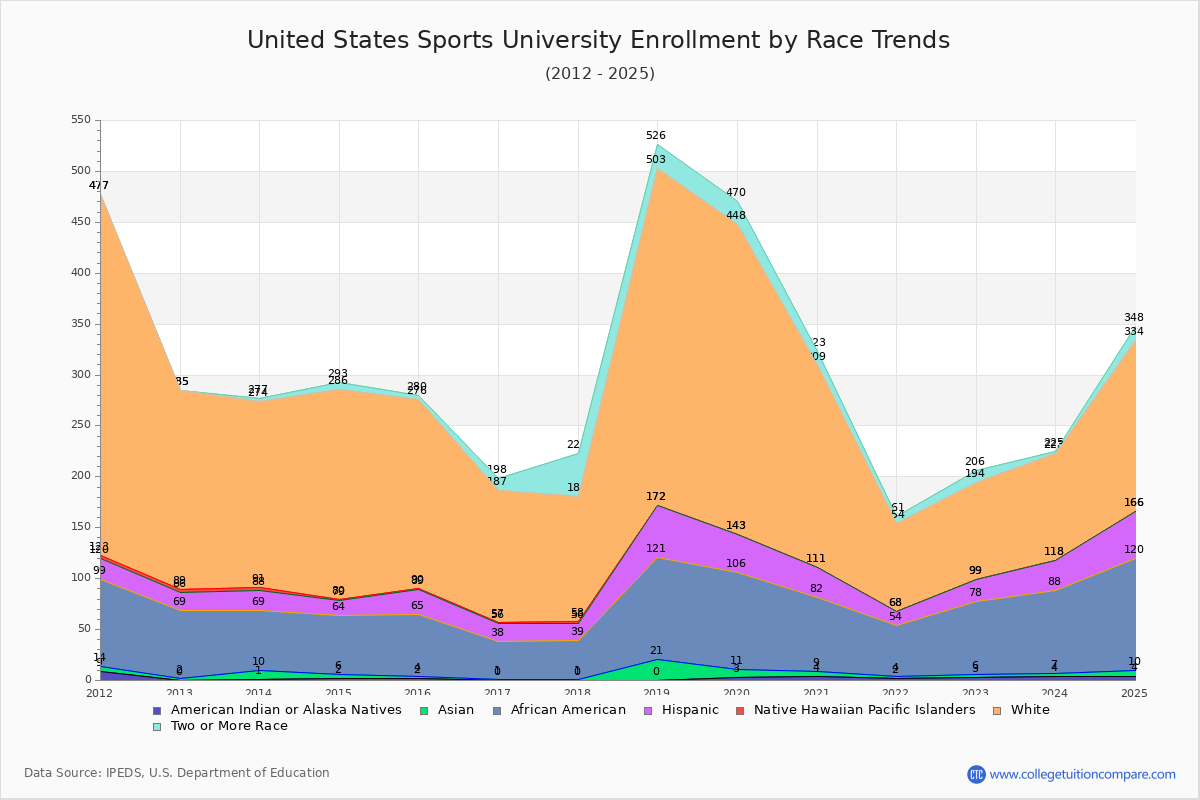
The percentage of white students is 45.78% and the percentage of black students is 29.97% at United States Sports University. 1.63% of enrolled students is Asian. Hispanic students comprise 12.53% of the student body.

Over the past 10 years, the racial composition has shifted. The percentage of white students decreased from 58.31% to 45.78%. Asian enrollment grew from 0.63% to 1.63%. Black student enrollment increased from 19.12% to 29.97%. Hispanic student representation expanded from 7.52% to 12.53%.

The overall racial diversity, measured by the Census Bureau Diversity Index, is 0.6831 which indicates that moderately diverse. This increased from 0.6176 a decade ago, suggesting that racial diversity has improved.

The following table and chart illustrate the student population trends by race/ethnicity at United States Sports University over the past 11 years (2015-2025).

YearAmerican Indian or Native AmericanAsianBlackHispanicNative Hawaiian or Other Pacific IslanderWhiteTwo or More Races
2015-1622612411864
2016-17013718113011
2017-18013817212342
2018-1902110051033123
2019-20389537030522
2020-21457329019814
2021-222250140867
2022-2333722109512
2023-2443813001052
2024-254611046016814
Average257229017315
United States Sports University Enrollment by Race Trends Chart

Distance Learning (Online Courses) Enrollment Changes

267 students are enrolled in online degree programs exclusively for the academic year 2024-2025, which is 73% of total students. The number of online students has decreased -14.97% since 2015. The following table and chart illustrate the changes in the online student population by enrolled type at United States Sports University from 2015 to 2025.

YearTotal EnrollmentOnline CompletelyEnrolled in Some Online CoursesNot Enrolled in Online Courses
2015-1631931450
2016-1721021000
2017-1824224101
2018-1954654600
2019-2049949900
2020-2133833800
2021-2216816800
2022-2324024000
2023-2427226606
2024-25367267928
Average320309102

Ratings & Review

Share your experiences and thoughts about United States Sports University. It will be a great help to applicants and prospective students!