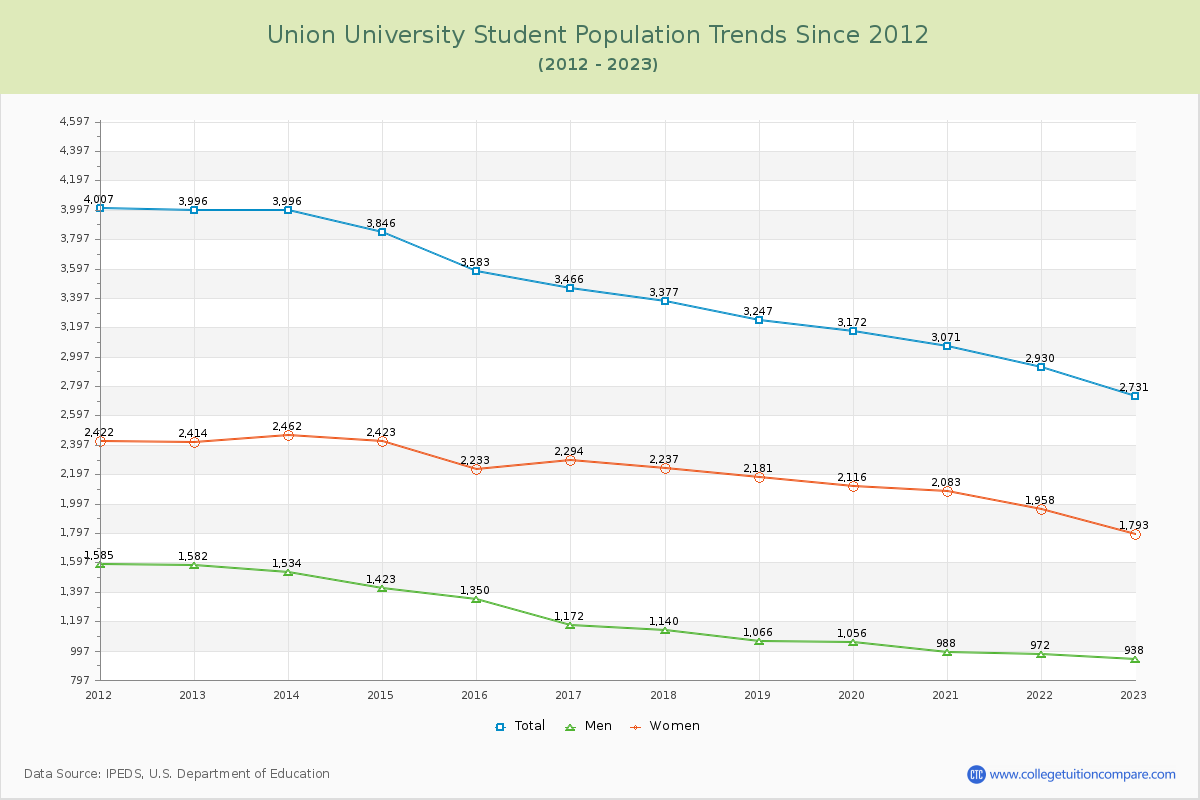
Student Population Changes
The average student population over the last 12 years is 3,401 where 2,731 students are attending the school for the academic year 2022-2023.
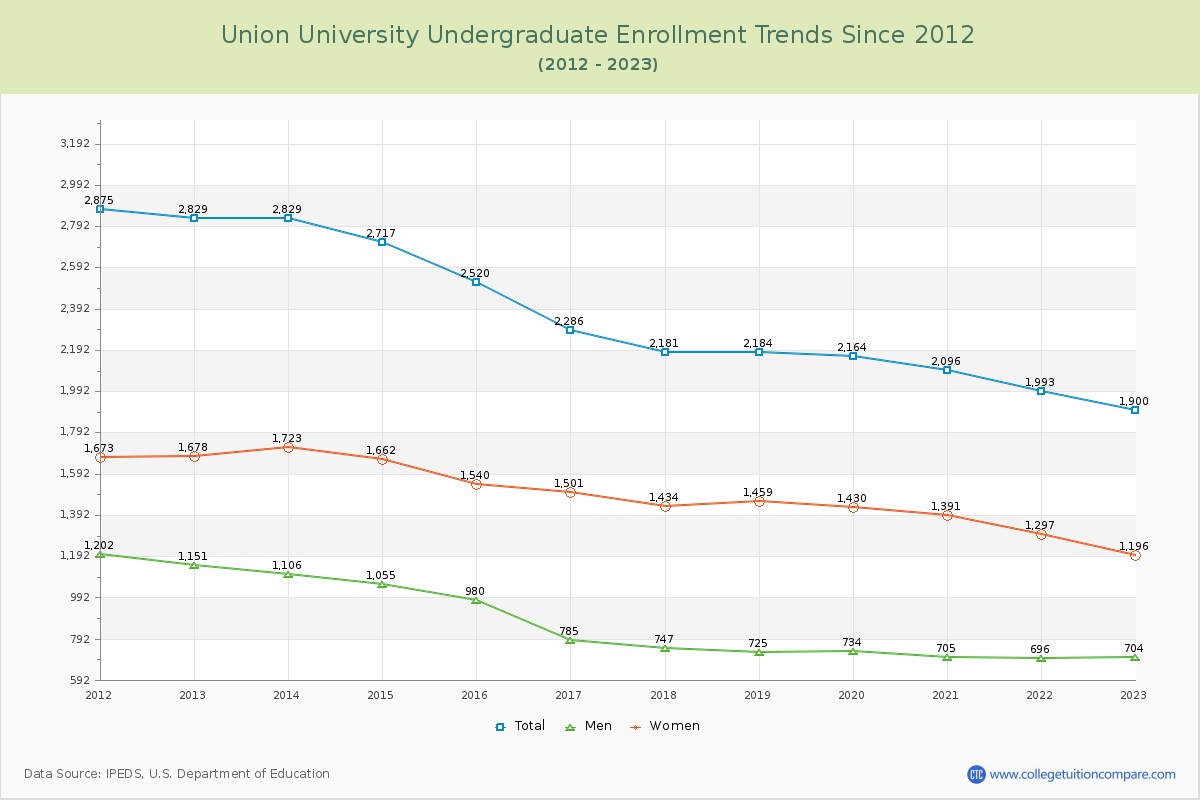
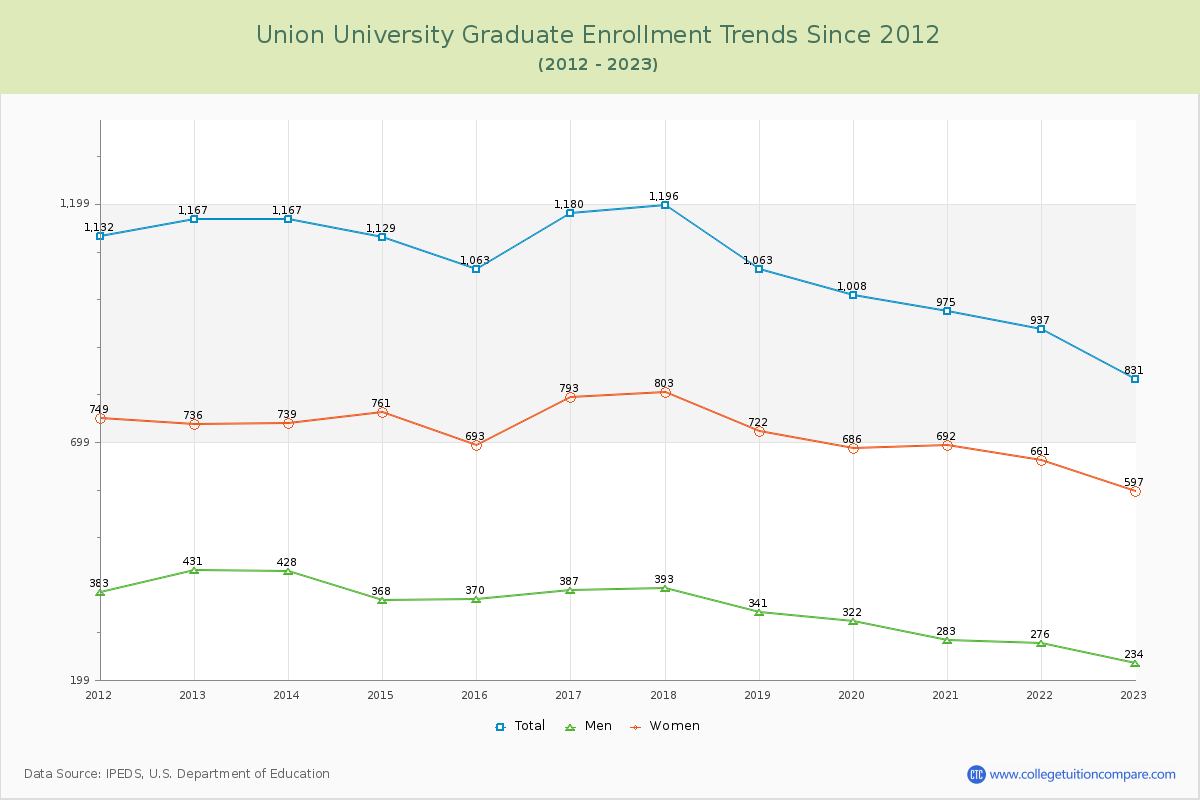
69.57% of total students is undergraduate students and 30.43% students is graduate students. The number of undergraduate students has decreased by 929 and the graduate enrollment has decreased by 336 over past 10 years.
The female to male ratio is 1.91 to 1 and it means that there are more female students enrolled in Union than male students.
The following table and chart illustrate the changes in student population by gender at Union University since 2012.
| Year | Total | Undergraduate | Graduate | ||||
|---|---|---|---|---|---|---|---|
| Total | Men | Women | Total | Men | Women | ||
| 2012-13 | 3,996 | 2,829 | 1,151 | 1,678 | 1,167 | 431 | 736 |
| 2013-14 | 3,996 0 | 2,829 0 | 1,106 -45 | 1,723 45 | 1,167 0 | 428 -3 | 739 3 |
| 2014-15 | 3,846 -150 | 2,717 -112 | 1,055 -51 | 1,662 -61 | 1,129 -38 | 368 -60 | 761 22 |
| 2015-16 | 3,583 -263 | 2,520 -197 | 980 -75 | 1,540 -122 | 1,063 -66 | 370 2 | 693 -68 |
| 2016-17 | 3,466 -117 | 2,286 -234 | 785 -195 | 1,501 -39 | 1,180 117 | 387 17 | 793 100 |
| 2017-18 | 3,377 -89 | 2,181 -105 | 747 -38 | 1,434 -67 | 1,196 16 | 393 6 | 803 10 |
| 2018-19 | 3,247 -130 | 2,184 3 | 725 -22 | 1,459 25 | 1,063 -133 | 341 -52 | 722 -81 |
| 2019-20 | 3,172 -75 | 2,164 -20 | 734 9 | 1,430 -29 | 1,008 -55 | 322 -19 | 686 -36 |
| 2020-21 | 3,071 -101 | 2,096 -68 | 705 -29 | 1,391 -39 | 975 -33 | 283 -39 | 692 6 |
| 2021-22 | 2,930 -141 | 1,993 -103 | 696 -9 | 1,297 -94 | 937 -38 | 276 -7 | 661 -31 |
| 2022-23 | 2,731 -199 | 1,900 -93 | 704 8 | 1,196 -101 | 831 -106 | 234 -42 | 597 -64 |
| Average | 3,401 | 2,336 | 853 | 1,483 | 1,065 | 348 | 717 |