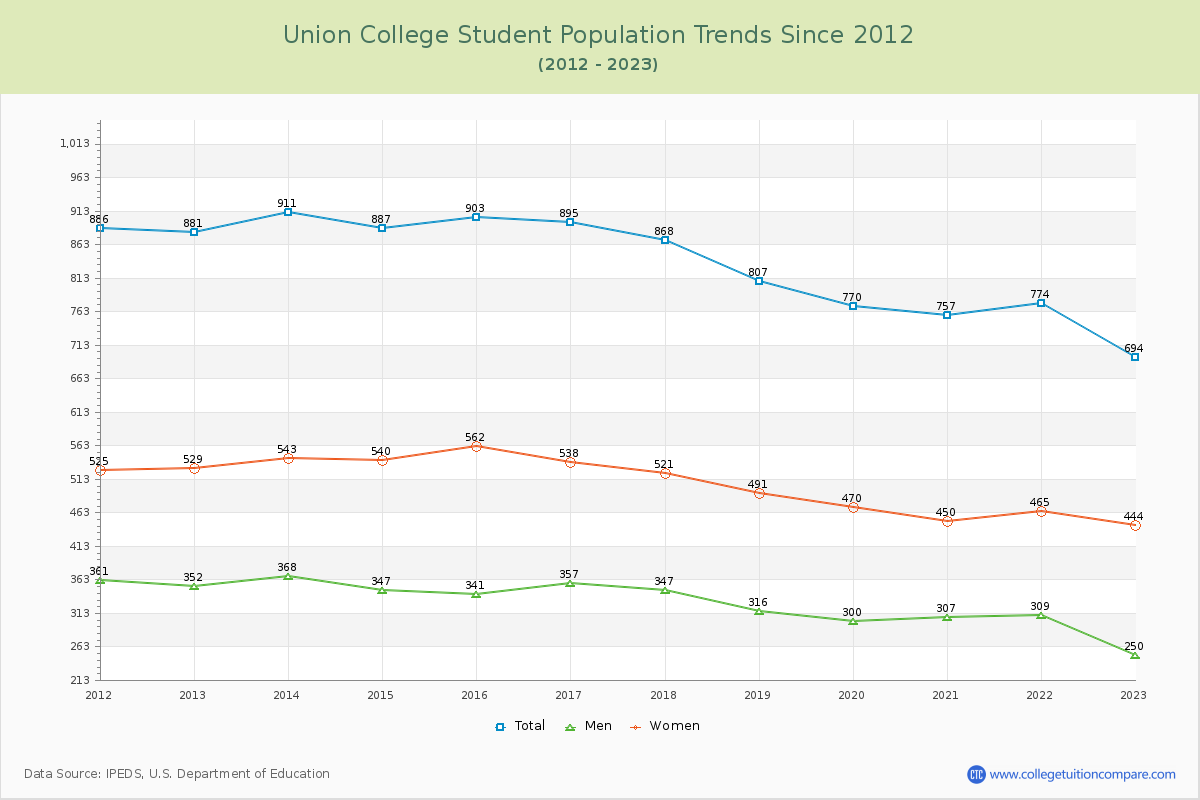
Student Population Changes
The average student population over the last 12 years is 832 where 694 students are attending the school for the academic year 2022-2023.
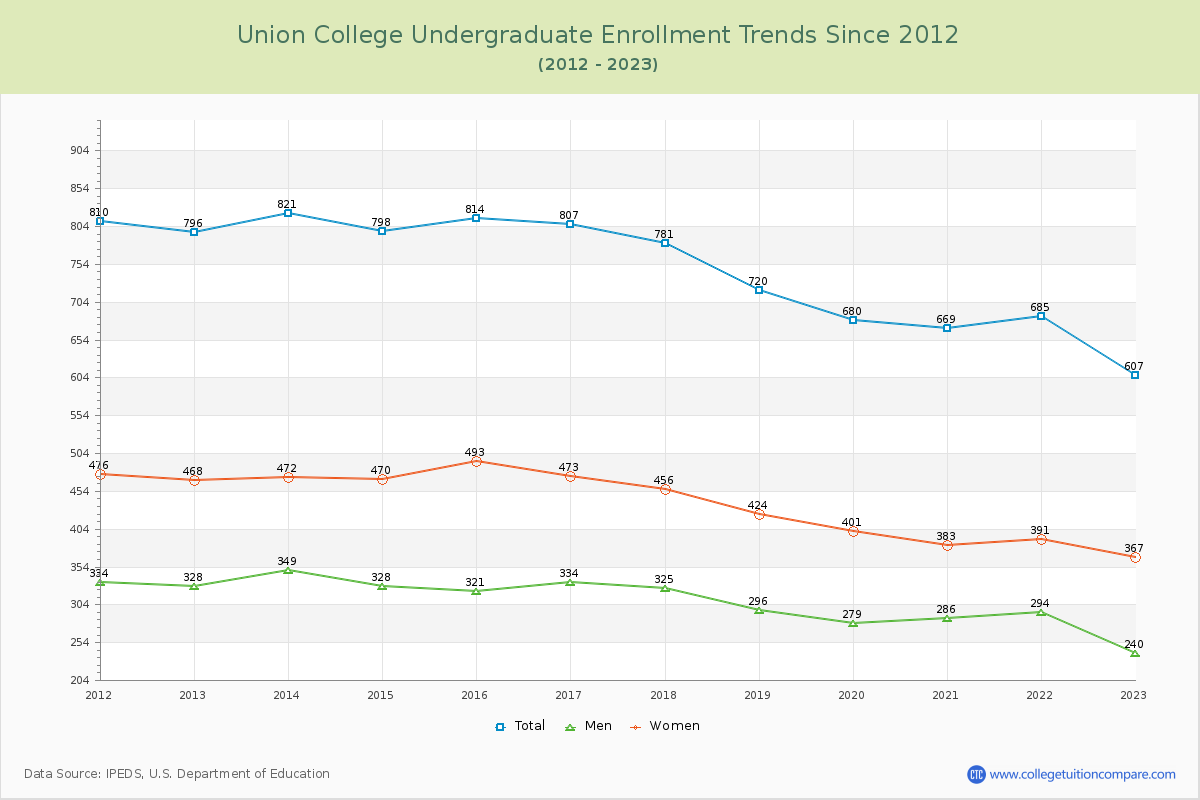
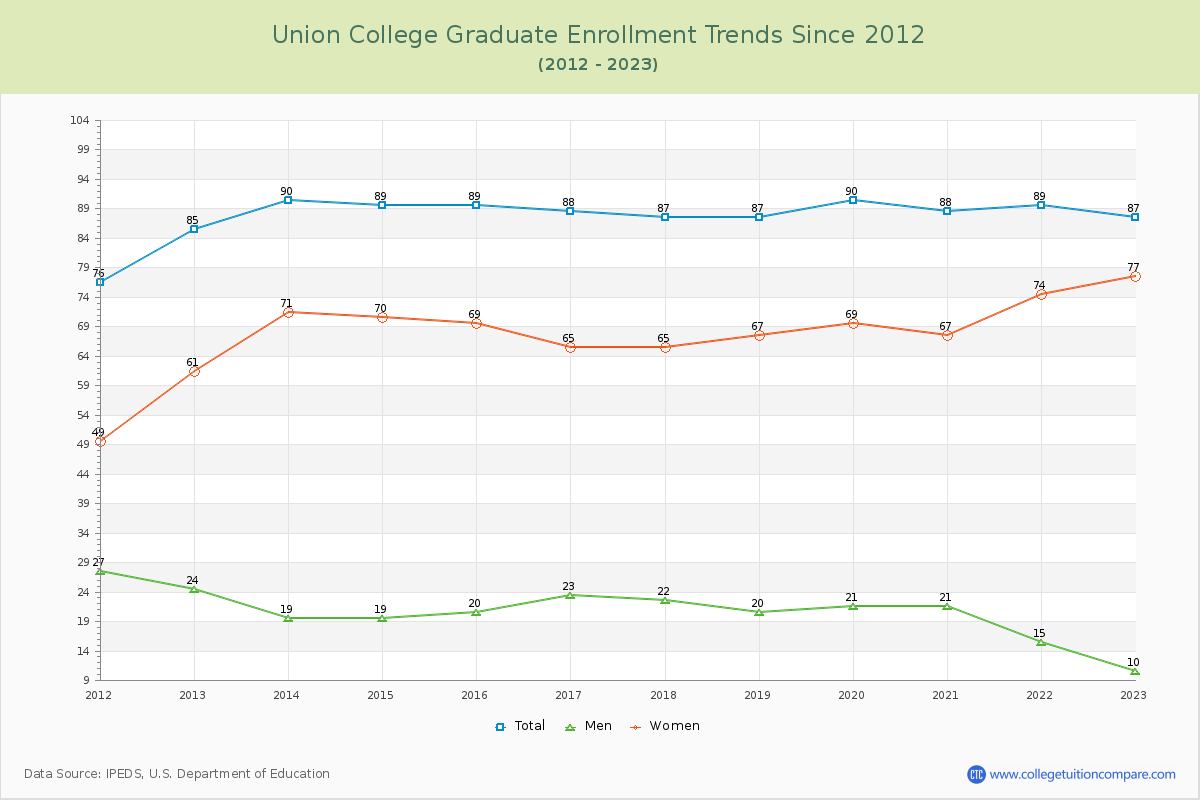
87.46% of total students is undergraduate students and 12.54% students is graduate students. The number of undergraduate students has decreased by 189 and the graduate enrollment has increased by 2 over past 10 years.
The female to male ratio is 1.78 to 1 and it means that there are more female students enrolled in Union than male students.
The following table and chart illustrate the changes in student population by gender at Union College since 2012.
| Year | Total | Undergraduate | Graduate | ||||
|---|---|---|---|---|---|---|---|
| Total | Men | Women | Total | Men | Women | ||
| 2012-13 | 881 | 796 | 328 | 468 | 85 | 24 | 61 |
| 2013-14 | 911 30 | 821 25 | 349 21 | 472 4 | 90 5 | 19 -5 | 71 10 |
| 2014-15 | 887 -24 | 798 -23 | 328 -21 | 470 -2 | 89 -1 | 19 0 | 70 -1 |
| 2015-16 | 903 16 | 814 16 | 321 -7 | 493 23 | 89 0 | 20 1 | 69 -1 |
| 2016-17 | 895 -8 | 807 -7 | 334 13 | 473 -20 | 88 -1 | 23 3 | 65 -4 |
| 2017-18 | 868 -27 | 781 -26 | 325 -9 | 456 -17 | 87 -1 | 22 -1 | 65 0 |
| 2018-19 | 807 -61 | 720 -61 | 296 -29 | 424 -32 | 87 0 | 20 -2 | 67 2 |
| 2019-20 | 770 -37 | 680 -40 | 279 -17 | 401 -23 | 90 3 | 21 1 | 69 2 |
| 2020-21 | 757 -13 | 669 -11 | 286 7 | 383 -18 | 88 -2 | 21 0 | 67 -2 |
| 2021-22 | 774 17 | 685 16 | 294 8 | 391 8 | 89 1 | 15 -6 | 74 7 |
| 2022-23 | 694 -80 | 607 -78 | 240 -54 | 367 -24 | 87 -2 | 10 -5 | 77 3 |
| Average | 832 | 743 | 307 | 436 | 88 | 19 | 69 |