Enrollment Trends at Ultimate Medical Academy

8,673

Total Enrollment

345

Men

8,328

Women

The student population at Ultimate Medical Academy is 8,932 (all undergraduate). The number of students has increased by 8,673 over the past decade.

The female to male ratio is 23.21 to 1 which means that majority of population is on female students.

8,849 students enrolled in online degree program exclusively and the number of online students has decreased by % since 2015.

Student Population Changes

The average student population over the last 11 years is 9,202 where 8,932 students are attending the school for the academic year 2024-2025.

The female to male ratio is 23.21 to 1 and it means that there are far more female students enrolled in Ultimate Medical Academy than male students.

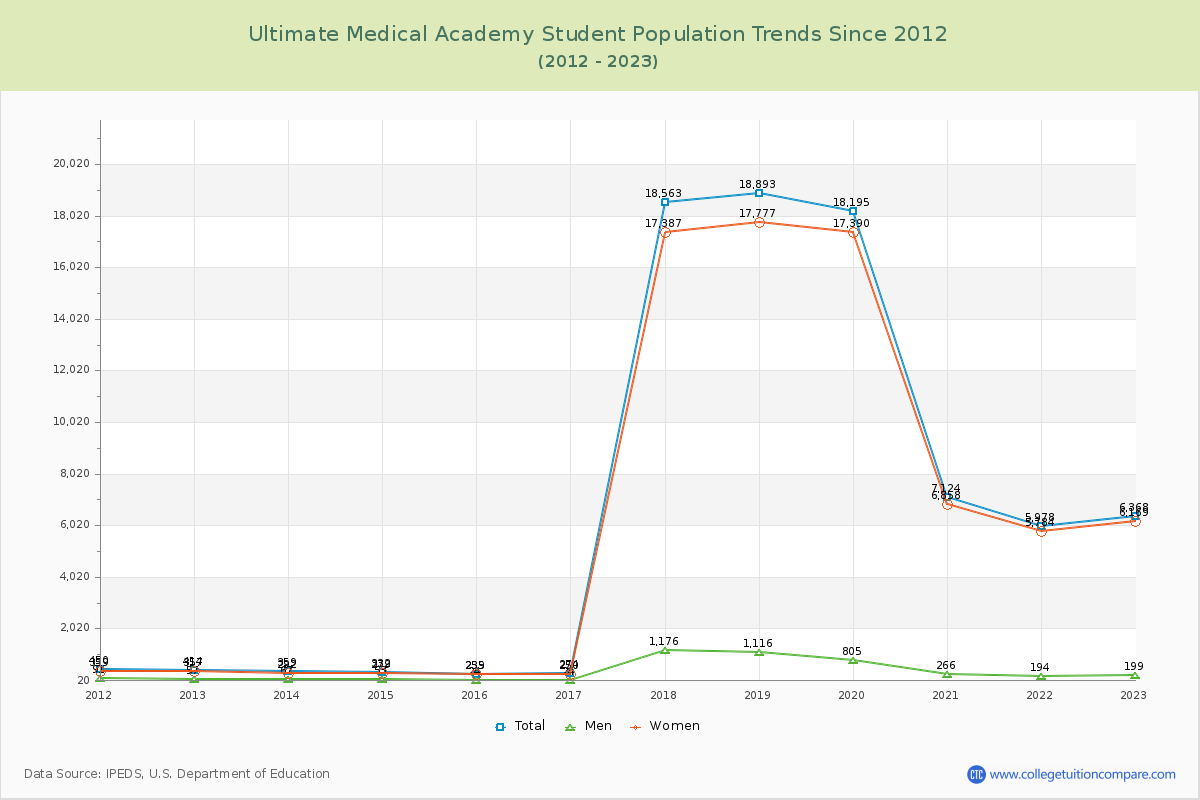
The following table and chart illustrate the changes in student population by gender at Ultimate Medical Academy since 2015.

YearTotalMenWomen
2015-1625924235
2016-17274
15
24250
15
2017-1818,563
18,289
1,176
1,152
17,387
17,137
2018-1918,893
330
1,116
-60
17,777
390
2019-2018,195
-698
805
-311
17,390
-387
2020-217,124
-11,071
266
-539
6,858
-10,532
2021-225,978
-1,146
194
-72
5,784
-1,074
2022-236,368
390
199
5
6,169
385
2023-247,436
1,068
236
37
7,200
1,031
2024-258,932
1,496
369
133
8,563
1,363
Average9,2024418,761
Ultimate Medical Academy Enrollment Trends Chart

Enrollment by Race/Ethnicity Changes

The percentage of white students is 32.56% and the percentage of black students is 63.52% at Ultimate Medical Academy. 0.47% of enrolled students is Asian. Hispanic students comprise 0.38% of the student body.

Over the past 10 years, the racial composition has shifted. The percentage of white students decreased from 40.54% to 32.56%. Asian enrollment declined from 1.16% to 0.47%. Black student enrollment increased from 33.98% to 63.52%. Hispanic student representation contracted from 13.13% to 0.38%.

The overall racial diversity, measured by the Census Bureau Diversity Index, is 0.4902 which indicates that somewhat diverse. This decreased from 0.7027 a decade ago, suggesting that racial diversity has declined.

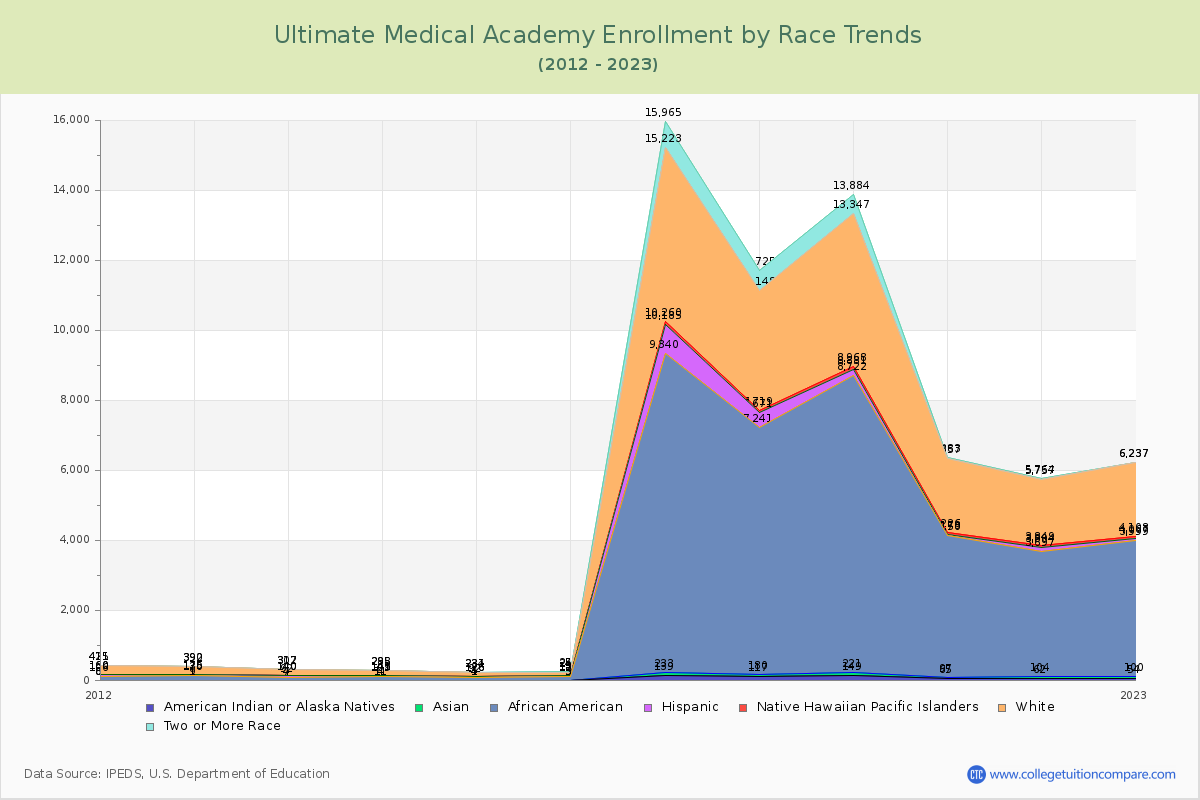
The following table and chart illustrate the student population trends by race/ethnicity at Ultimate Medical Academy over the past 11 years (2015-2025).

YearAmerican Indian or Native AmericanAsianBlackHispanicNative Hawaiian or Other Pacific IslanderWhiteTwo or More Races
2015-1613883401053
2016-1732120300869
2017-18139949,107845754,963742
2018-19117637,061430483,429577
2019-20149728,501159874,379537
2020-2165324,05323532,13126
2021-2262423,593107451,9087
2022-2354463,89968412,1290
2023-2486424,40043652,6680
2024-25116425,67434702,9080
Average79444,650177482,471190
Ultimate Medical Academy Enrollment by Race Trends Chart

Distance Learning (Online Courses) Enrollment Changes

8,849 students are enrolled in online degree programs exclusively for the academic year 2024-2025, which is 99% of total students. The number of online students has decreased % since 2015. The following table and chart illustrate the changes in the online student population by enrolled type at Ultimate Medical Academy from 2015 to 2025.

YearTotal EnrollmentOnline CompletelyEnrolled in Some Online CoursesNot Enrolled in Online Courses
2015-1625900259
2016-1727400274
2017-1818,56318,3450218
2018-1918,89318,6430250
2019-2018,19518,0230172
2020-217,1246,9670157
2021-225,9785,962016
2022-236,3686,288080
2023-247,4367,3269614
2024-258,9328,8496716
Average9,2029,04016146

Ratings & Review

Share your experiences and thoughts about Ultimate Medical Academy. It will be a great help to applicants and prospective students!