Enrollment Trends at Turning Point Beauty

74

Total Enrollment

6

Men

68

Women

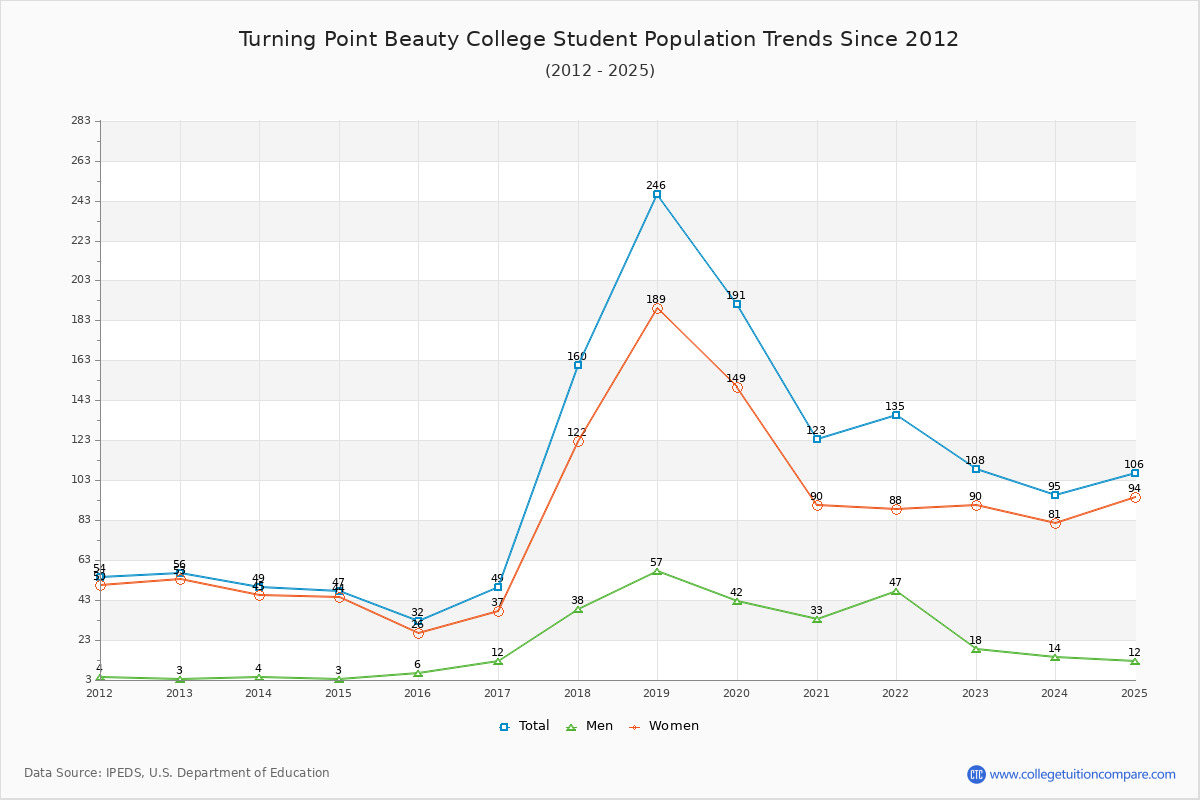
The student population at Turning Point Beauty College is 106 (all undergraduate). The number of students has increased by 74 over the past decade.

The female to male ratio is 7.83 to 1 which means that majority of population is on female students.

All students have enrolled in on-campus classes (Turning Point Beauty College does not offer online degree/certificate program).

Student Population Changes

The average student population over the last 11 years is 125 where 106 students are attending the school for the academic year 2024-2025.

The female to male ratio is 7.83 to 1 and it means that there are far more female students enrolled in Turning Point Beauty than male students.

The following table and chart illustrate the changes in student population by gender at Turning Point Beauty College since 2015.

YearTotalMenWomen
2015-1632626
2016-1749
17
12
6
37
11
2017-18160
111
38
26
122
85
2018-19246
86
57
19
189
67
2019-20191
-55
42
-15
149
-40
2020-21123
-68
33
-9
90
-59
2021-22135
12
47
14
88
-2
2022-23108
-27
18
-29
90
2
2023-2495
-13
14
-4
81
-9
2024-25106
11
12
-2
94
13
Average1252897
Turning Point Beauty College Enrollment Trends Chart

Enrollment by Race/Ethnicity Changes

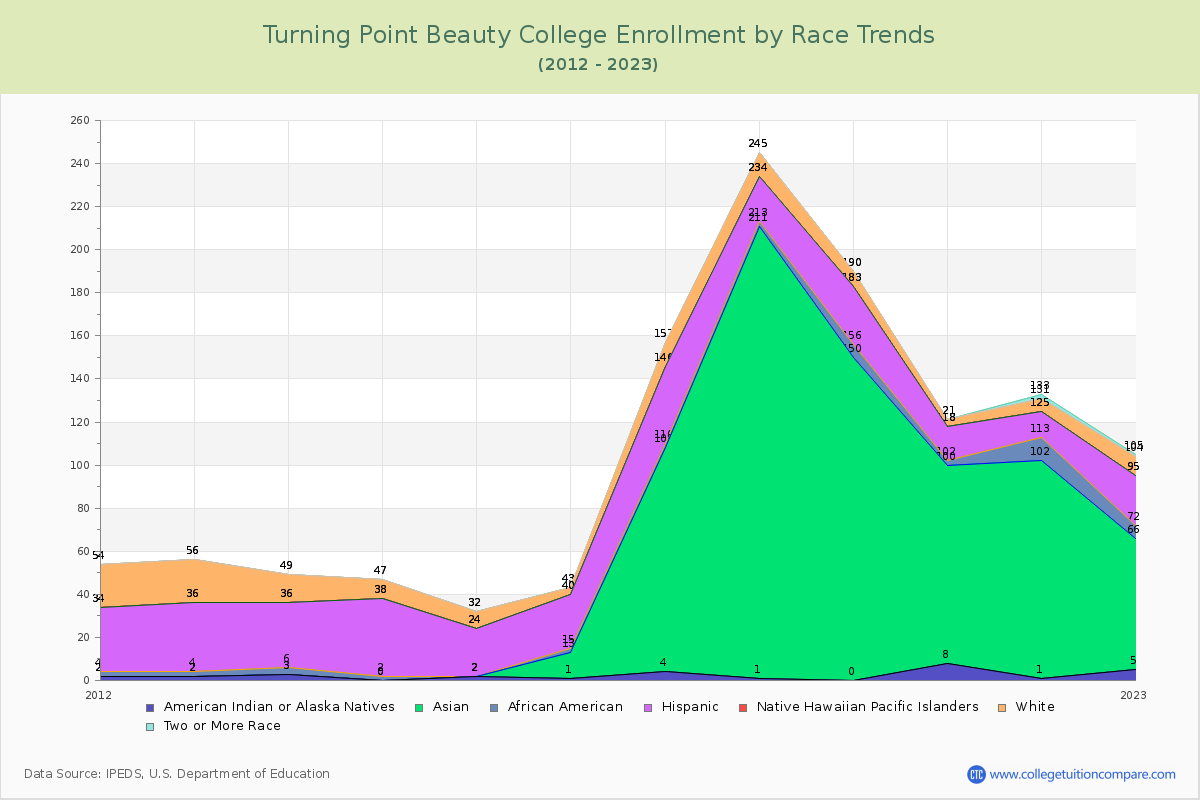
The percentage of white students is 21.70% and the percentage of black students is 7.55% at Turning Point Beauty College. 27.36% of enrolled students is Asian. Hispanic students comprise 33.96% of the student body.

Over the past 10 years, the racial composition has shifted. The percentage of white students decreased from 25.00% to 21.70%. Asian enrollment grew from 0.00% to 27.36%. Black student enrollment increased from 0.00% to 7.55%. Hispanic student representation contracted from 68.75% to 33.96%.

The overall racial diversity, measured by the Census Bureau Diversity Index, is 0.7547 which indicates that quite diverse. This increased from 0.4609 a decade ago, suggesting that racial diversity has improved.

The following table and chart illustrate the student population trends by race/ethnicity at Turning Point Beauty College over the past 11 years (2015-2025).

YearAmerican Indian or Native AmericanAsianBlackHispanicNative Hawaiian or Other Pacific IslanderWhiteTwo or More Races
2015-1620022080
2016-17112225030
2017-1841042360110
2018-1912102210110
2019-200150627070
2020-21892216030
2021-2211011112062
2022-23561623091
2023-2414514170111
2024-250298361235
Average280524091
Turning Point Beauty College Enrollment by Race Trends Chart

Distance Learning (Online Courses) Enrollment Changes

Turning Point Beauty College does not offer online degree/certificate programs. All Students have enrolled in on-campus programs.


Ratings & Review

Share your experiences and thoughts about Turning Point Beauty College. It will be a great help to applicants and prospective students!