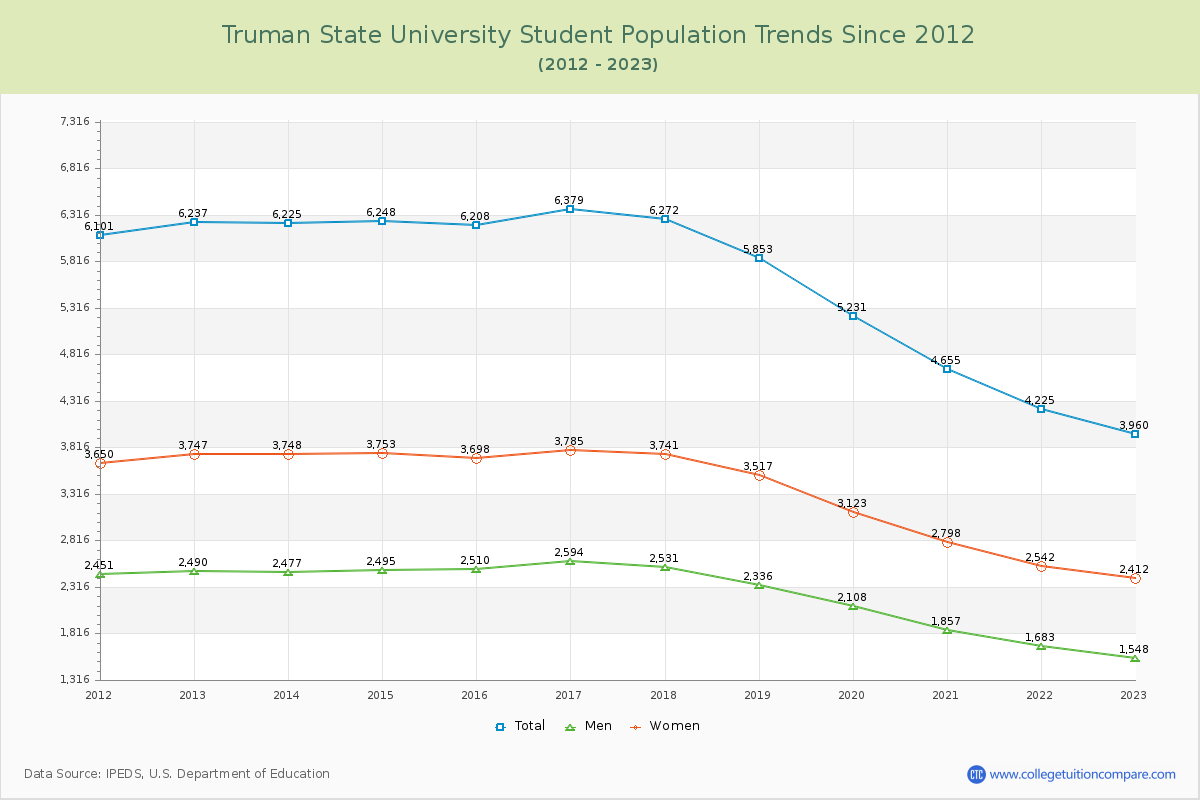
Student Population Changes
The average student population over the last 12 years is 5,590 where 3,960 students are attending the school for the academic year 2022-2023.
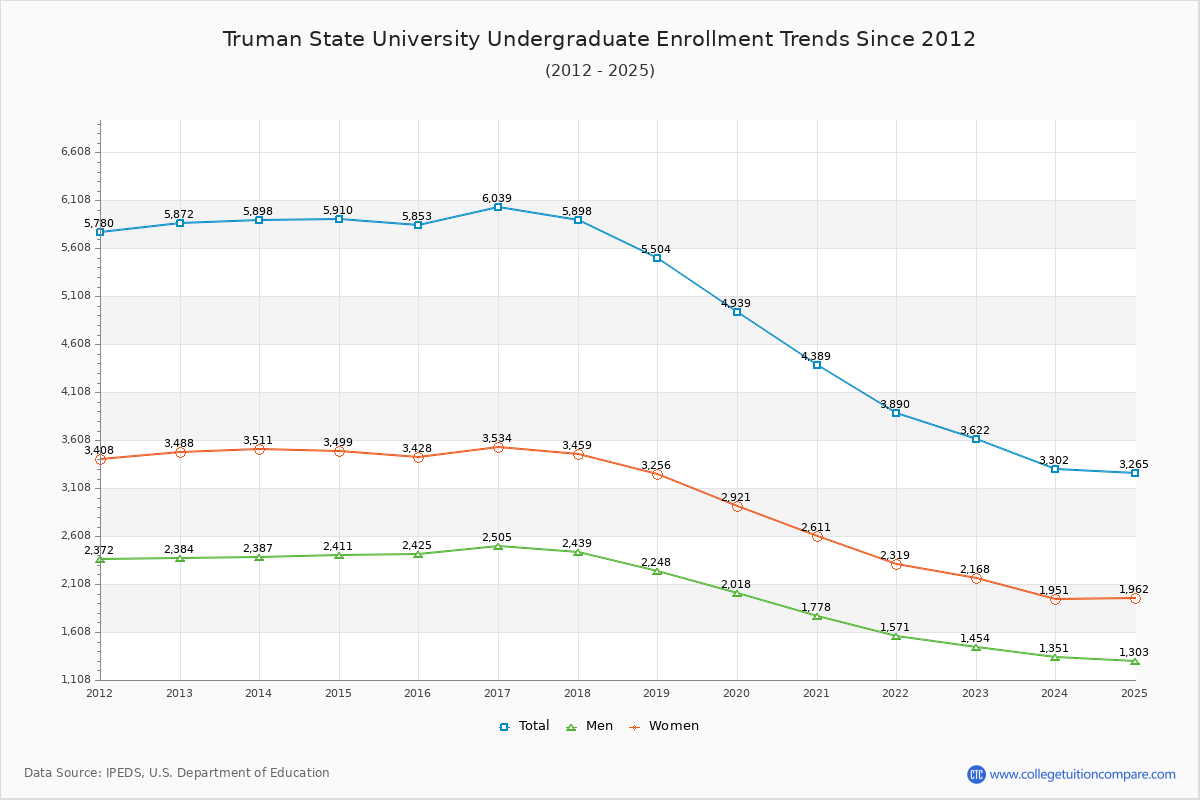
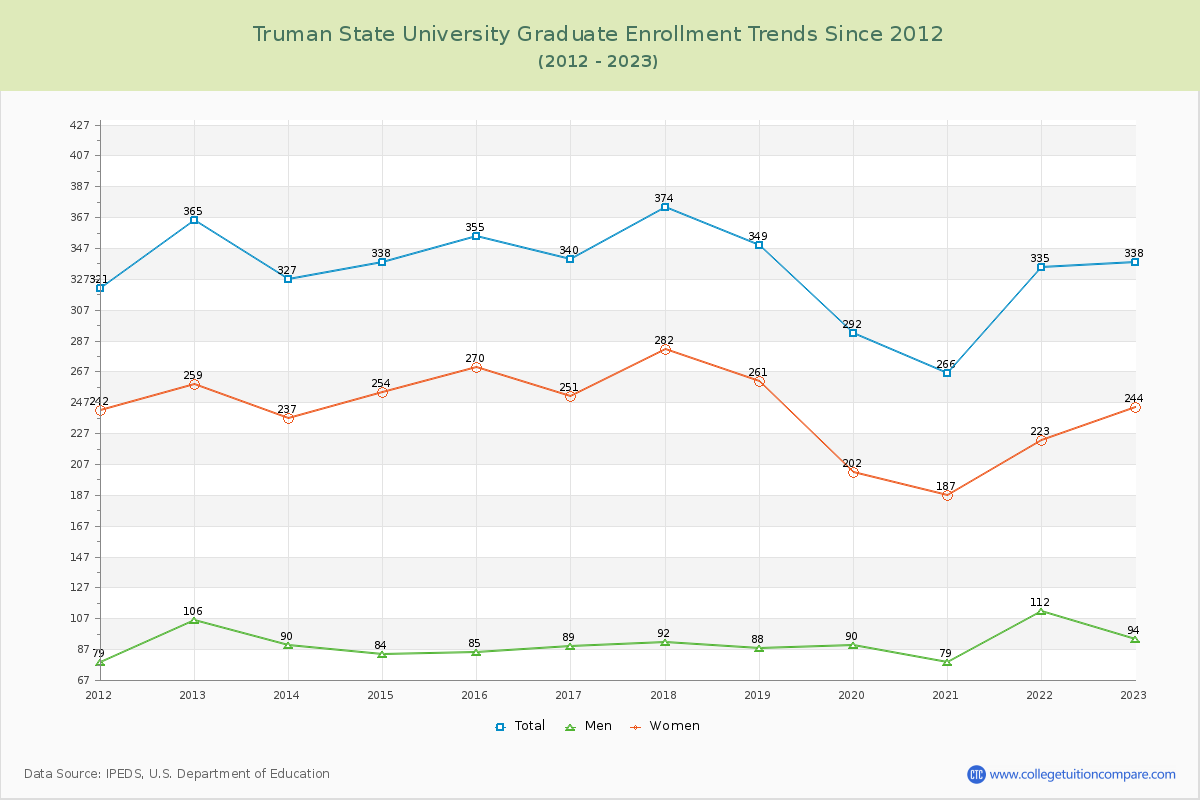
91.46% of total students is undergraduate students and 8.54% students is graduate students. The number of undergraduate students has decreased by 2,250 and the graduate enrollment has decreased by 27 over past 10 years.
The female to male ratio is 1.56 to 1 and it means that there are more female students enrolled in Truman than male students.
The following table and chart illustrate the changes in student population by gender at Truman State University since 2012.
| Year | Total | Undergraduate | Graduate | ||||
|---|---|---|---|---|---|---|---|
| Total | Men | Women | Total | Men | Women | ||
| 2012-13 | 6,237 | 5,872 | 2,384 | 3,488 | 365 | 106 | 259 |
| 2013-14 | 6,225 -12 | 5,898 26 | 2,387 3 | 3,511 23 | 327 -38 | 90 -16 | 237 -22 |
| 2014-15 | 6,248 23 | 5,910 12 | 2,411 24 | 3,499 -12 | 338 11 | 84 -6 | 254 17 |
| 2015-16 | 6,208 -40 | 5,853 -57 | 2,425 14 | 3,428 -71 | 355 17 | 85 1 | 270 16 |
| 2016-17 | 6,379 171 | 6,039 186 | 2,505 80 | 3,534 106 | 340 -15 | 89 4 | 251 -19 |
| 2017-18 | 6,272 -107 | 5,898 -141 | 2,439 -66 | 3,459 -75 | 374 34 | 92 3 | 282 31 |
| 2018-19 | 5,853 -419 | 5,504 -394 | 2,248 -191 | 3,256 -203 | 349 -25 | 88 -4 | 261 -21 |
| 2019-20 | 5,231 -622 | 4,939 -565 | 2,018 -230 | 2,921 -335 | 292 -57 | 90 2 | 202 -59 |
| 2020-21 | 4,655 -576 | 4,389 -550 | 1,778 -240 | 2,611 -310 | 266 -26 | 79 -11 | 187 -15 |
| 2021-22 | 4,225 -430 | 3,890 -499 | 1,571 -207 | 2,319 -292 | 335 69 | 112 33 | 223 36 |
| 2022-23 | 3,960 -265 | 3,622 -268 | 1,454 -117 | 2,168 -151 | 338 3 | 94 -18 | 244 21 |
| Average | 5,590 | 5,256 | 2,147 | 3,109 | 334 | 92 | 243 |