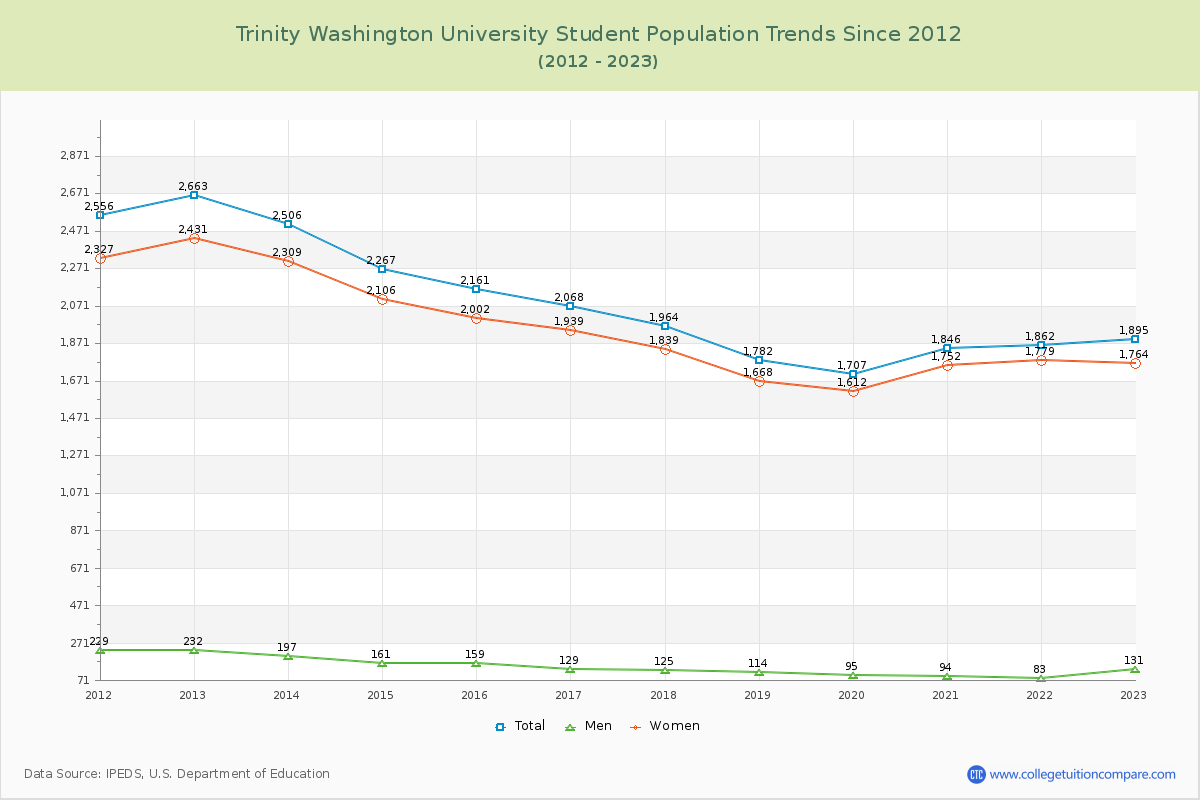
Student Population Changes
The average student population over the last 12 years is 2,066 where 1,895 students are attending the school for the academic year 2022-2023.
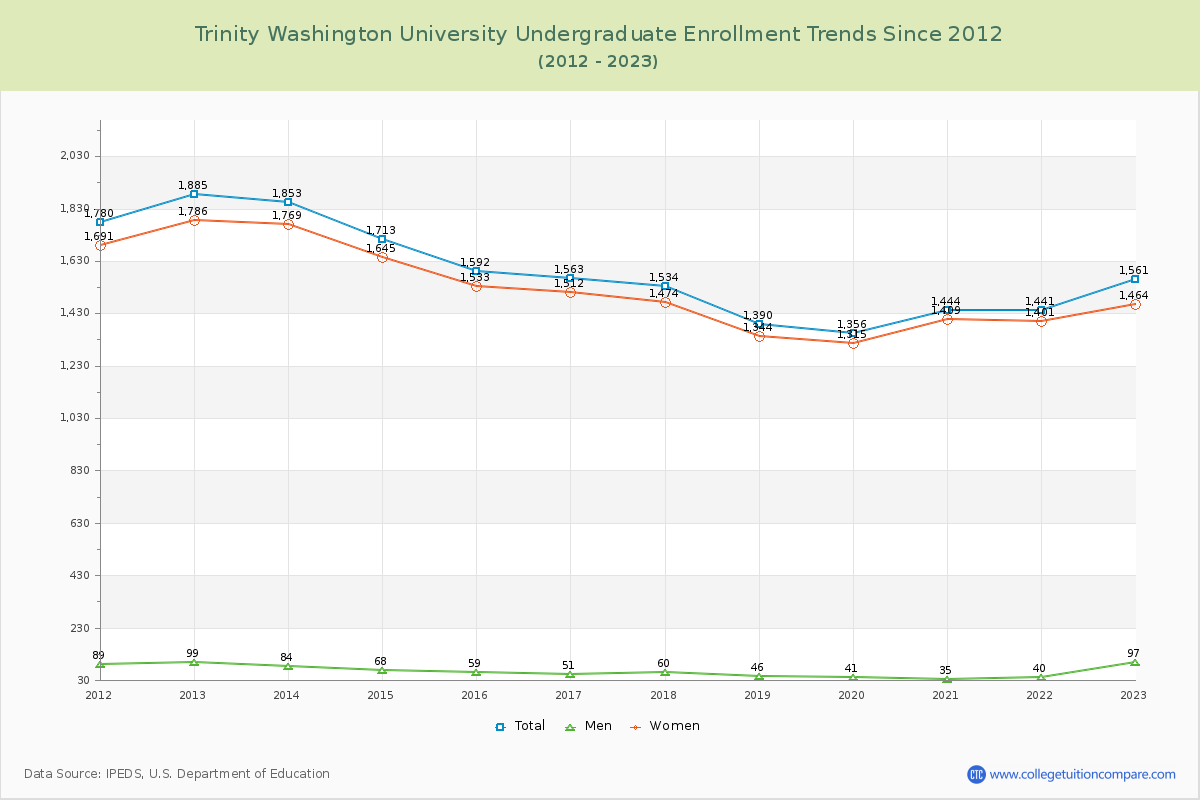
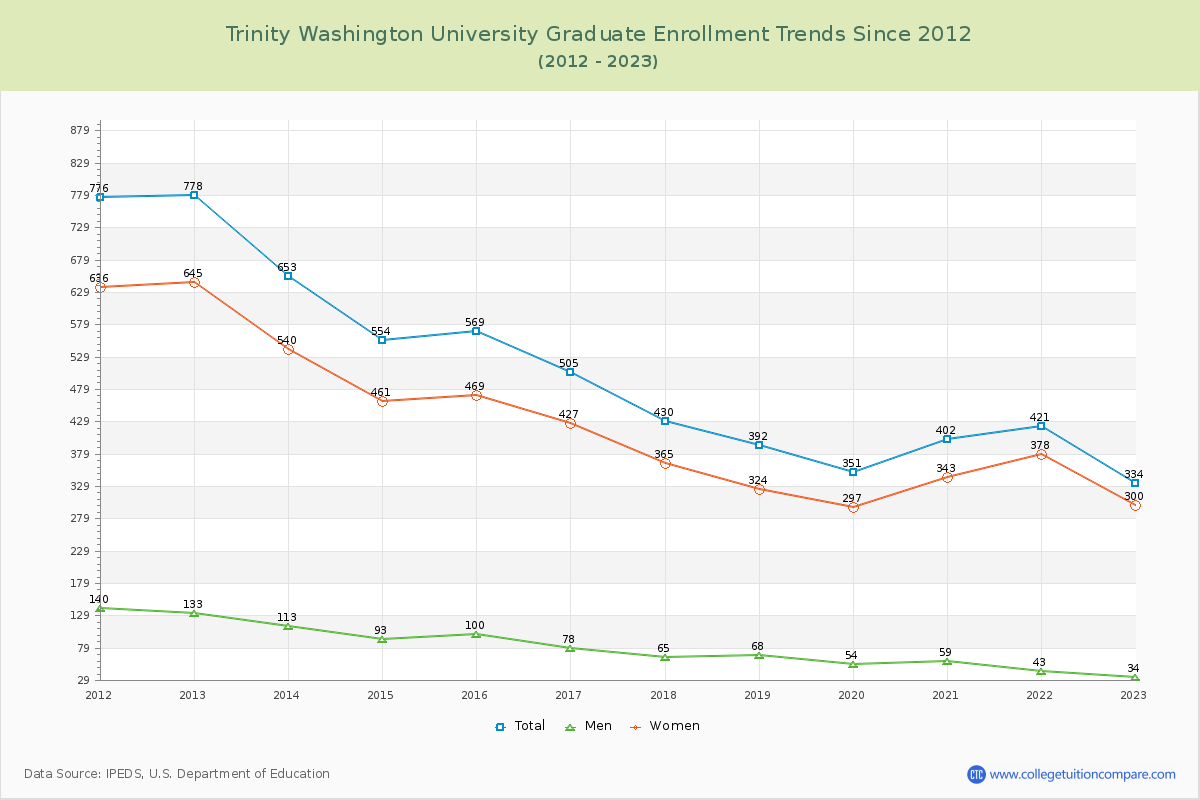
82.37% of total students is undergraduate students and 17.63% students is graduate students. The number of undergraduate students has decreased by 324 and the graduate enrollment has decreased by 444 over past 10 years.
The following table and chart illustrate the changes in student population by gender at Trinity Washington University since 2012.
| Year | Total | Undergraduate | Graduate | ||||
|---|---|---|---|---|---|---|---|
| Total | Men | Women | Total | Men | Women | ||
| 2012-13 | 2,663 | 1,885 | 99 | 1,786 | 778 | 133 | 645 |
| 2013-14 | 2,506 -157 | 1,853 -32 | 84 -15 | 1,769 -17 | 653 -125 | 113 -20 | 540 -105 |
| 2014-15 | 2,267 -239 | 1,713 -140 | 68 -16 | 1,645 -124 | 554 -99 | 93 -20 | 461 -79 |
| 2015-16 | 2,161 -106 | 1,592 -121 | 59 -9 | 1,533 -112 | 569 15 | 100 7 | 469 8 |
| 2016-17 | 2,068 -93 | 1,563 -29 | 51 -8 | 1,512 -21 | 505 -64 | 78 -22 | 427 -42 |
| 2017-18 | 1,964 -104 | 1,534 -29 | 60 9 | 1,474 -38 | 430 -75 | 65 -13 | 365 -62 |
| 2018-19 | 1,782 -182 | 1,390 -144 | 46 -14 | 1,344 -130 | 392 -38 | 68 3 | 324 -41 |
| 2019-20 | 1,707 -75 | 1,356 -34 | 41 -5 | 1,315 -29 | 351 -41 | 54 -14 | 297 -27 |
| 2020-21 | 1,846 139 | 1,444 88 | 35 -6 | 1,409 94 | 402 51 | 59 5 | 343 46 |
| 2021-22 | 1,862 16 | 1,441 -3 | 40 5 | 1,401 -8 | 421 19 | 43 -16 | 378 35 |
| 2022-23 | 1,895 33 | 1,561 120 | 97 57 | 1,464 63 | 334 -87 | 34 -9 | 300 -78 |
| Average | 2,066 | 1,576 | 62 | 1,514 | 490 | 76 | 414 |