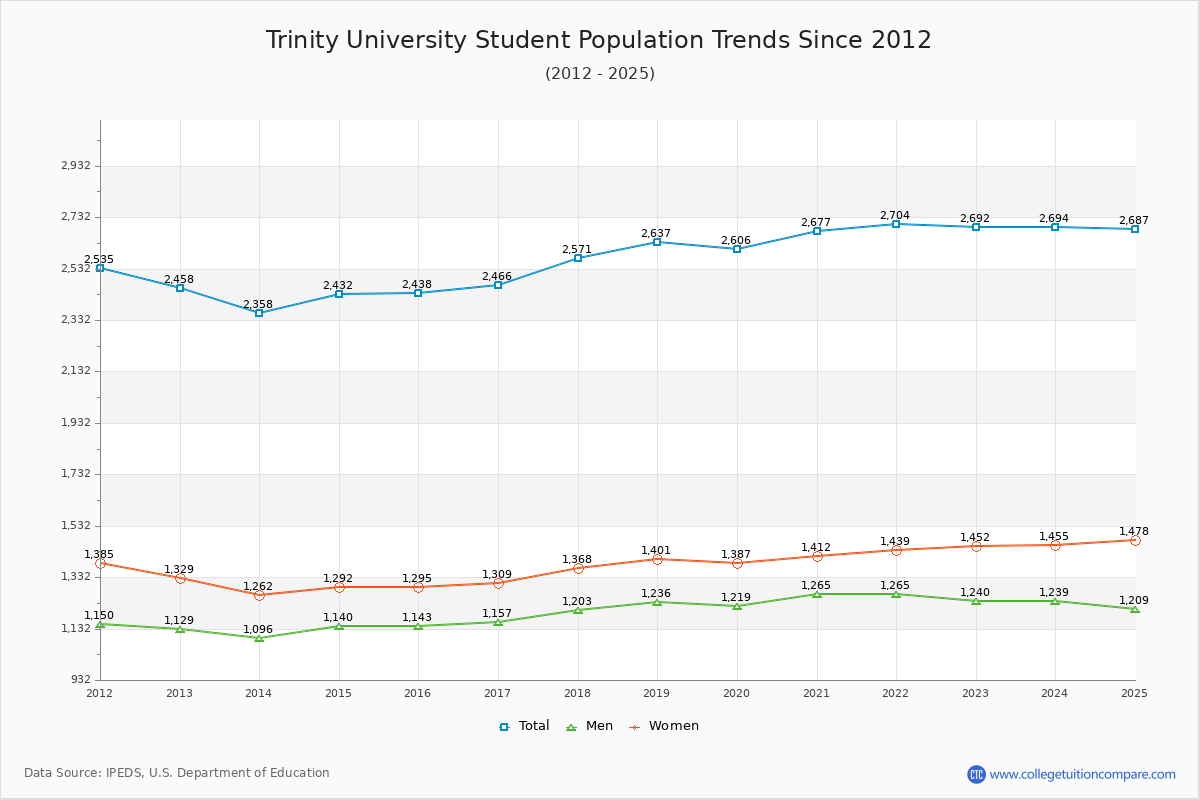
Student Population Changes
The average student population over the last 12 years is 2,549 where 2,692 students are attending the school for the academic year 2022-2023.
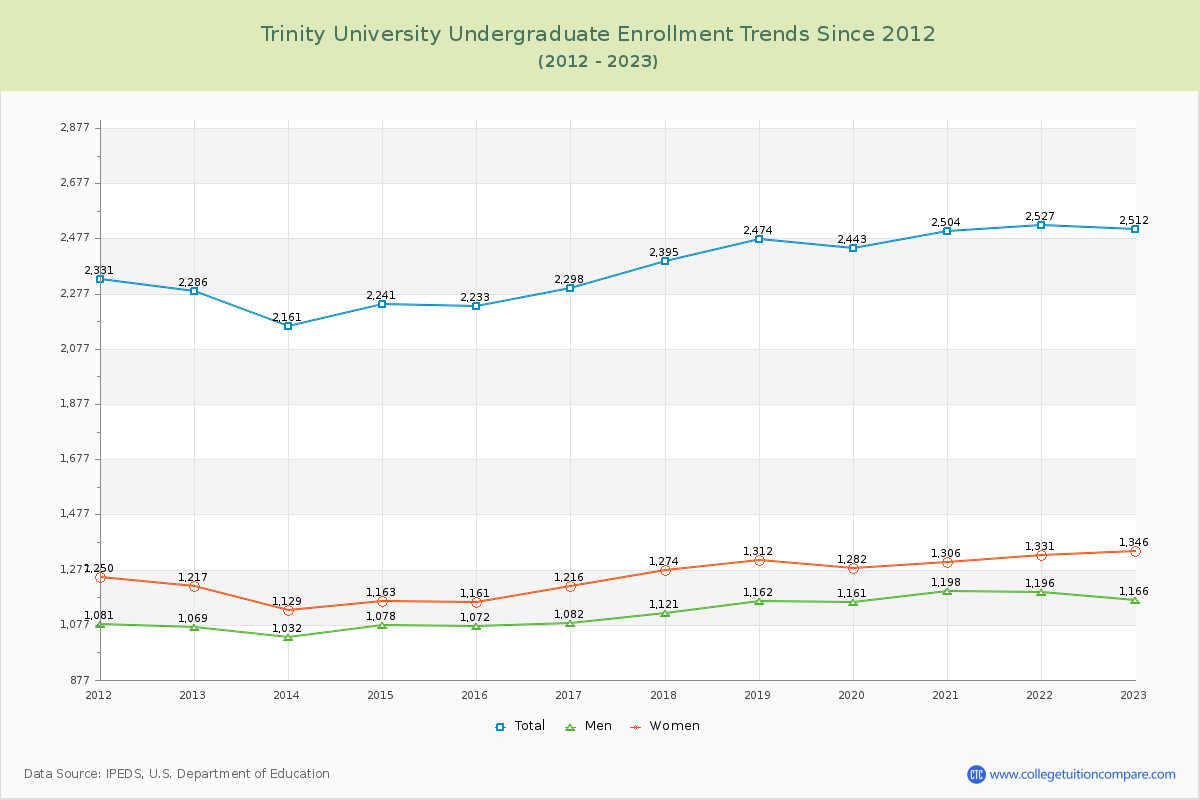
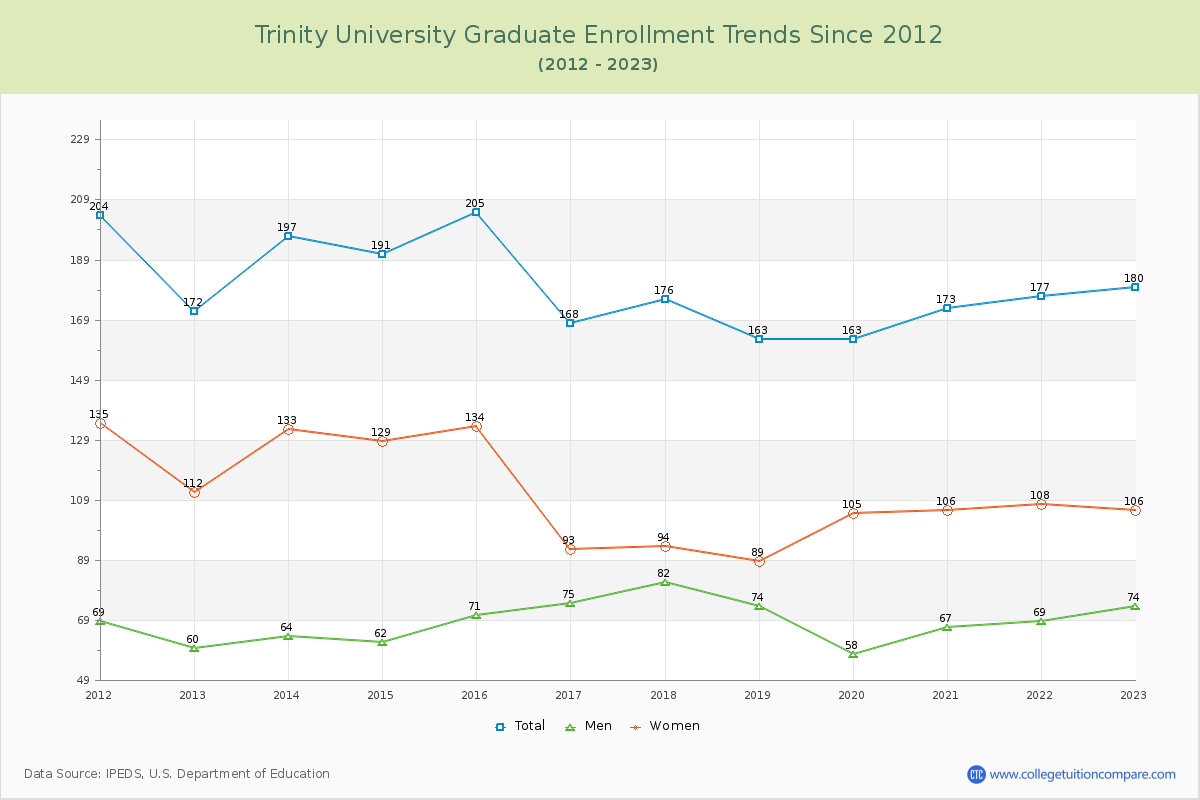
93.31% of total students is undergraduate students and 6.69% students is graduate students. The number of undergraduate students has increased by 226 and the graduate enrollment has increased by 8 over past 10 years.
The female to male ratio is 1.17 to 1 and it means that there are slightly more female students enrolled in Trinity than male students.
The following table and chart illustrate the changes in student population by gender at Trinity University since 2012.
| Year | Total | Undergraduate | Graduate | ||||
|---|---|---|---|---|---|---|---|
| Total | Men | Women | Total | Men | Women | ||
| 2012-13 | 2,458 | 2,286 | 1,069 | 1,217 | 172 | 60 | 112 |
| 2013-14 | 2,358 -100 | 2,161 -125 | 1,032 -37 | 1,129 -88 | 197 25 | 64 4 | 133 21 |
| 2014-15 | 2,432 74 | 2,241 80 | 1,078 46 | 1,163 34 | 191 -6 | 62 -2 | 129 -4 |
| 2015-16 | 2,438 6 | 2,233 -8 | 1,072 -6 | 1,161 -2 | 205 14 | 71 9 | 134 5 |
| 2016-17 | 2,466 28 | 2,298 65 | 1,082 10 | 1,216 55 | 168 -37 | 75 4 | 93 -41 |
| 2017-18 | 2,571 105 | 2,395 97 | 1,121 39 | 1,274 58 | 176 8 | 82 7 | 94 1 |
| 2018-19 | 2,637 66 | 2,474 79 | 1,162 41 | 1,312 38 | 163 -13 | 74 -8 | 89 -5 |
| 2019-20 | 2,606 -31 | 2,443 -31 | 1,161 -1 | 1,282 -30 | 163 0 | 58 -16 | 105 16 |
| 2020-21 | 2,677 71 | 2,504 61 | 1,198 37 | 1,306 24 | 173 10 | 67 9 | 106 1 |
| 2021-22 | 2,704 27 | 2,527 23 | 1,196 -2 | 1,331 25 | 177 4 | 69 2 | 108 2 |
| 2022-23 | 2,692 -12 | 2,512 -15 | 1,166 -30 | 1,346 15 | 180 3 | 74 5 | 106 -2 |
| Average | 2,549 | 2,370 | 1,122 | 1,249 | 179 | 69 | 110 |