Student Population Changes

The average student population over the last 12 years is 240 where 289 students are attending the school for the academic year 2022-2023.
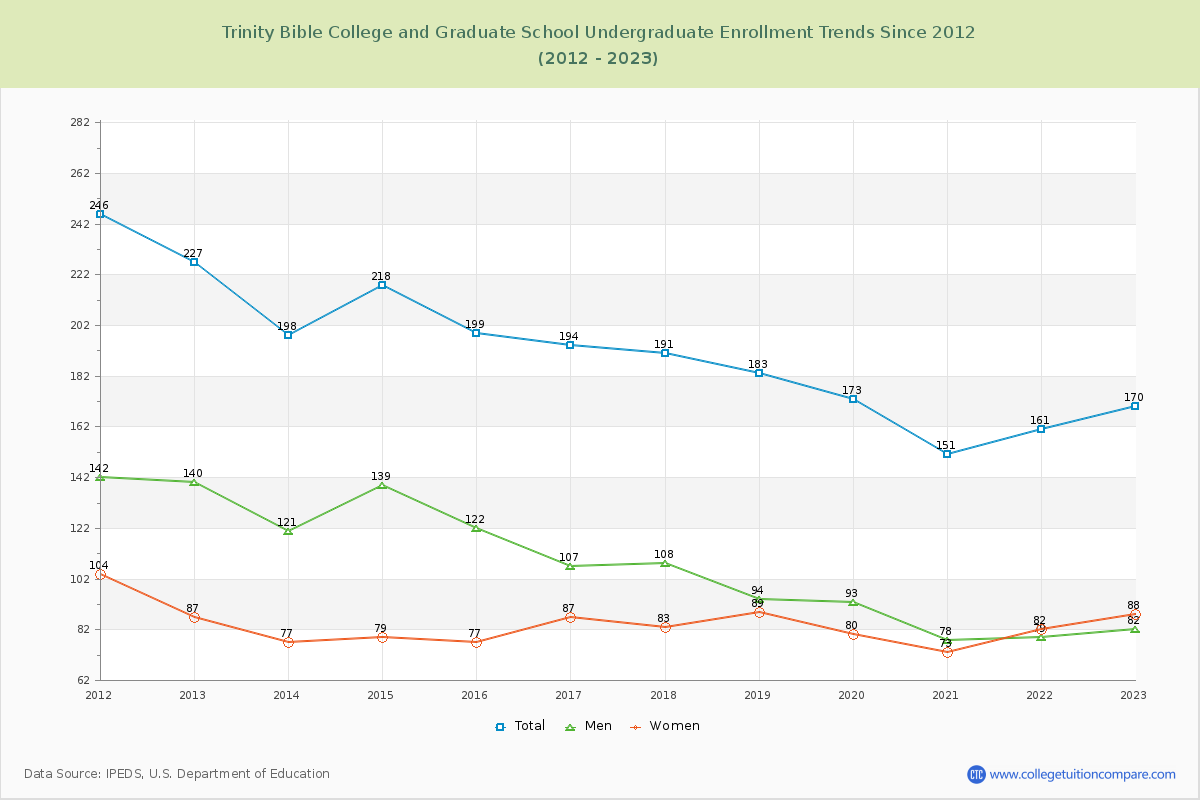
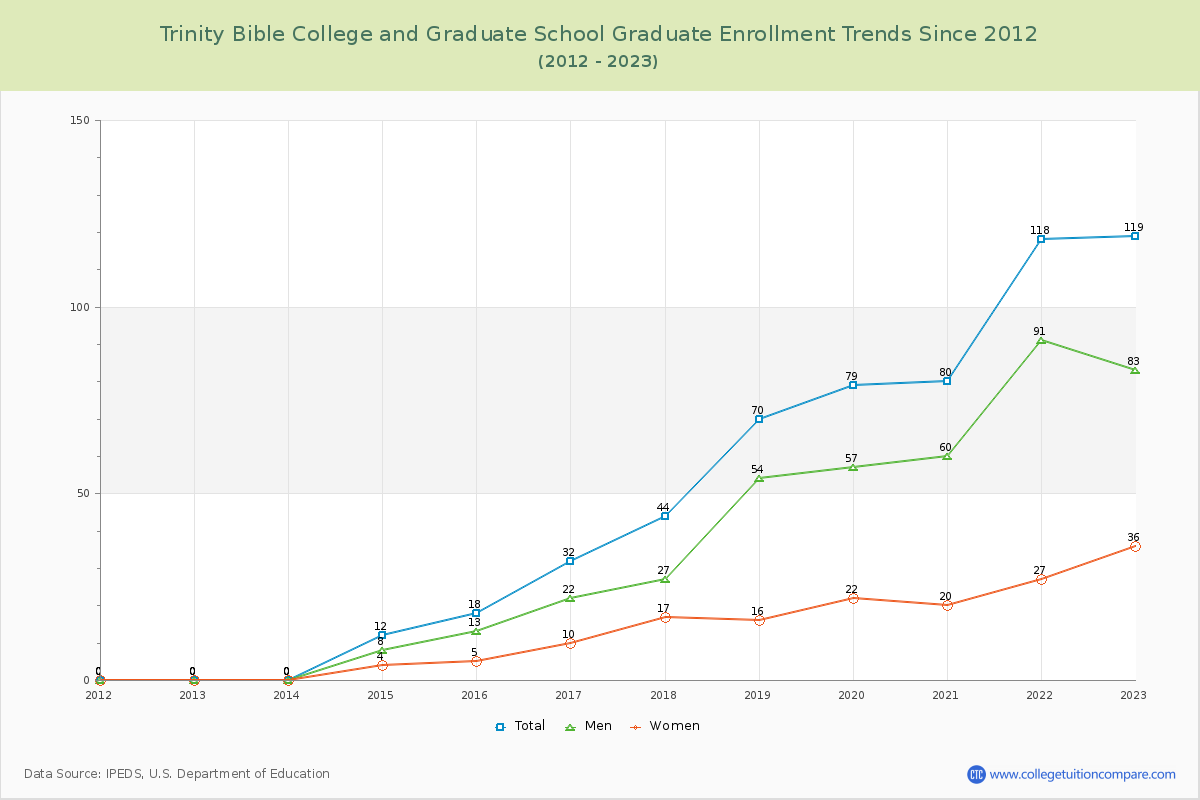
58.82% of total students is undergraduate students and 41.18% students is graduate students. The number of undergraduate students has decreased by 57 and the graduate enrollment has increased by 119 over past 10 years.
The female to male ratio is 0.75 to 1 and it means that there are more male students enrolled in Trinity Bible College and Graduate School than female students.
The following table and chart illustrate the changes in student population by gender at Trinity Bible College and Graduate School since 2012.
TableInteractive ChartDownloadable Chart
Student Population Changes of Trinity Bible College and Graduate School
Trinity Bible College and Graduate School Enrollment Trends Chart

Undergraduate Enrollment Changes

The average number of Undergraduate students over the last 12 years is 188 where 170 students are attending the Undergraduate school for the academic year 2022-2023. The following table and chart illustrate the changes in Undergraduate enrollment by attending status and gender at Trinity Bible College and Graduate School since 2012.
TableInteractive ChartDownloadable Chart
Undergraduate Enrollment Changes of Trinity Bible College and Graduate School
Trinity Bible College and Graduate School Undergraduate Enrollment Trends Chart

Graduate Enrollment Changes

The average number of Graduate students over the last 12 years is 52 where 119 students are attending the Graduate school for the academic year 2022-2023. The following table and chart illustrate the changes in Graduate enrollment by attending status and gender at Trinity Bible College and Graduate School since 2012.
TableInteractive ChartDownloadable Chart
Graduate Enrollment Changes of Trinity Bible College and Graduate School
Trinity Bible College and Graduate School Graduate Enrollment Trends Chart

Enrollment by Race/Ethnicity Changes

The percentage of white students is 71.28%. The percentage was 71.81% 10 years ago and Trinity Bible College and Graduate School still has a high percentage of white students. 2.08% of enrolled students is Asian and 4.50% is black students.
The following table and chart illustrate the student population trends by race/ethnicity at Trinity Bible College and Graduate School over the past 12 years (2012-2023).
TableInteractive ChartDownloadable Chart
Enrollment by Race/Ethnicity Changes of Trinity Bible College and Graduate School
Trinity Bible College and Graduate School Enrollment by Race Trends Chart

Distance Learning (Online Courses) Enrollment Changes

94 students are enrolled in online degree programs exclusively for the academic year 2022-2023, which is 33% of total students. The number of online students has increased 422.22% since 2014. The following table and chart illustrate the changes in the online student population by enrolled type at Trinity Bible College and Graduate School from 2014 to 2023.
TableChart
Distance Learning (Online Courses) Enrollment Changes of Trinity Bible College and Graduate School

Compare Trinity Bible College and Graduate School in a Variety of Ways

Related Articles and Ads