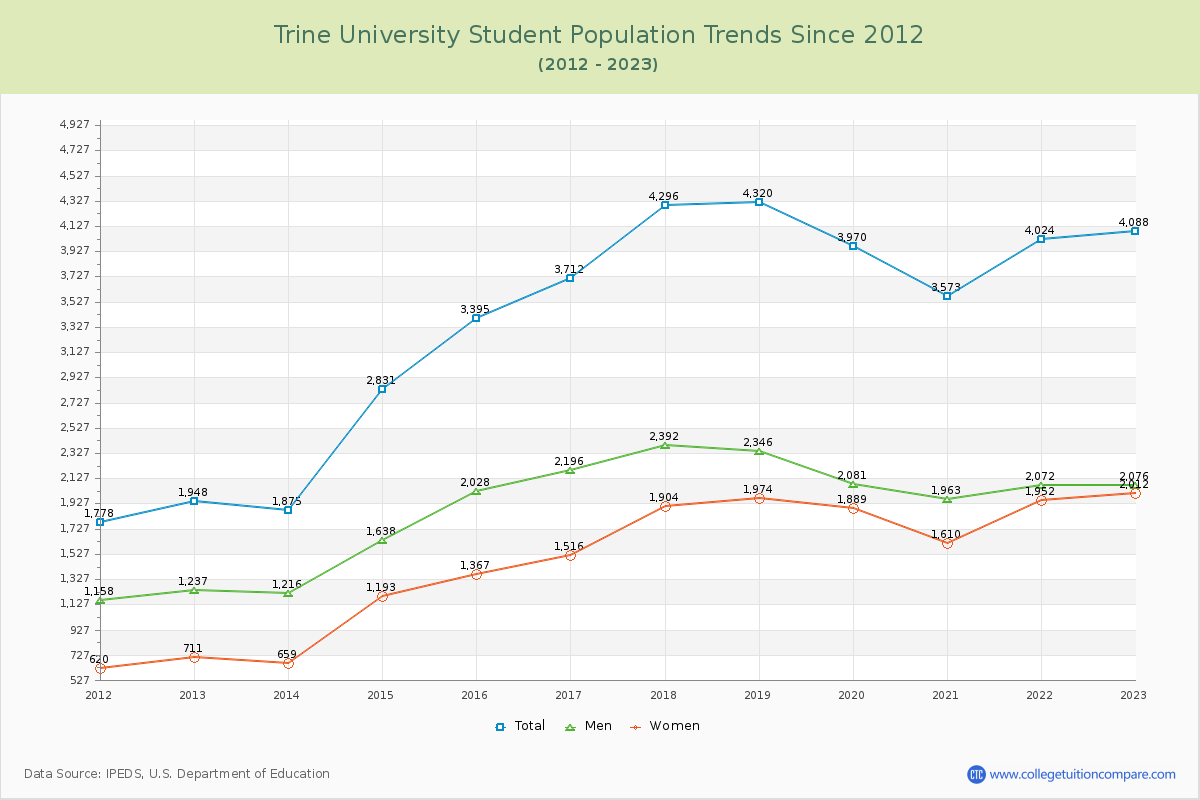
Student Population Changes
The average student population over the last 12 years is 3,457 where 4,088 students are attending the school for the academic year 2022-2023.
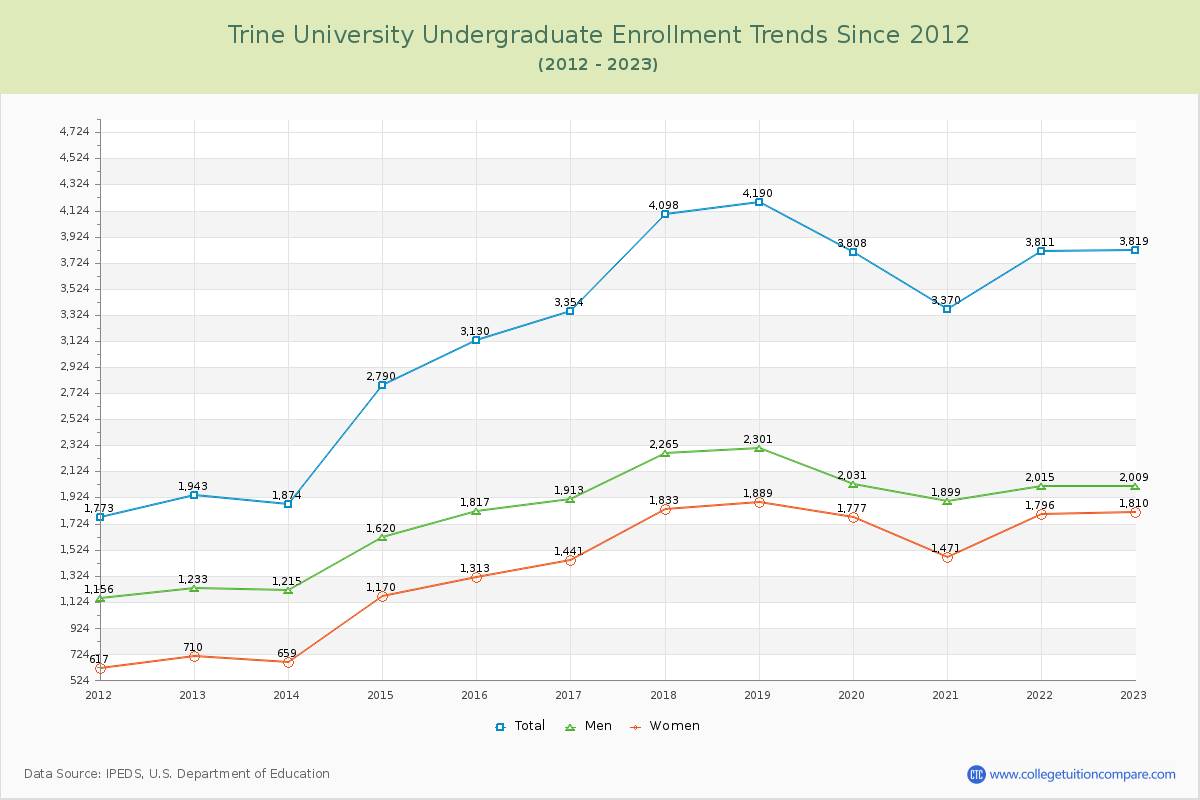
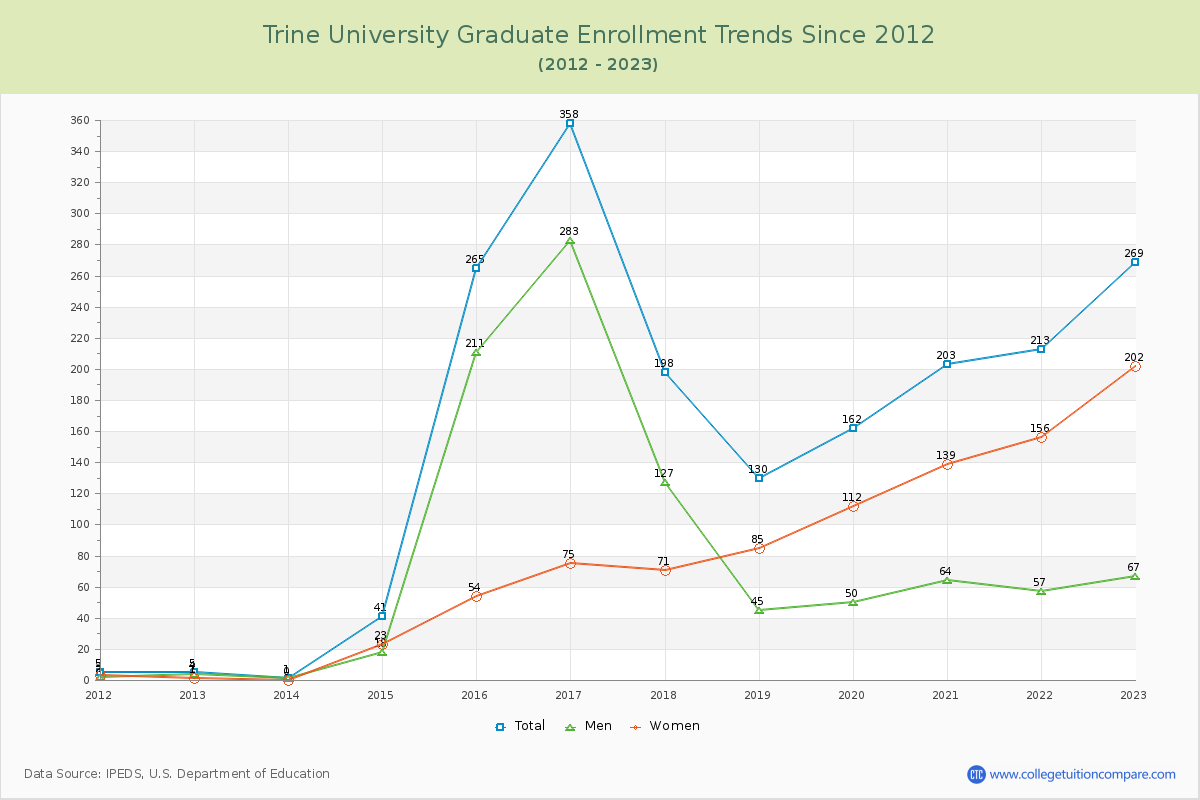
93.42% of total students is undergraduate students and 6.58% students is graduate students. The number of undergraduate students has increased by 1,876 and the graduate enrollment has increased by 264 over past 10 years.
The female to male ratio is 0.97 to 1 and it means that there are similar numbers of female and male students enrolled in Trine.
The following table and chart illustrate the changes in student population by gender at Trine University since 2012.
| Year | Total | Undergraduate | Graduate | ||||
|---|---|---|---|---|---|---|---|
| Total | Men | Women | Total | Men | Women | ||
| 2012-13 | 1,948 | 1,943 | 1,233 | 710 | 5 | 4 | 1 |
| 2013-14 | 1,875 -73 | 1,874 -69 | 1,215 -18 | 659 -51 | 1 -4 | 1 -3 | 0 -1 |
| 2014-15 | 2,831 956 | 2,790 916 | 1,620 405 | 1,170 511 | 41 40 | 18 17 | 23 23 |
| 2015-16 | 3,395 564 | 3,130 340 | 1,817 197 | 1,313 143 | 265 224 | 211 193 | 54 31 |
| 2016-17 | 3,712 317 | 3,354 224 | 1,913 96 | 1,441 128 | 358 93 | 283 72 | 75 21 |
| 2017-18 | 4,296 584 | 4,098 744 | 2,265 352 | 1,833 392 | 198 -160 | 127 -156 | 71 -4 |
| 2018-19 | 4,320 24 | 4,190 92 | 2,301 36 | 1,889 56 | 130 -68 | 45 -82 | 85 14 |
| 2019-20 | 3,970 -350 | 3,808 -382 | 2,031 -270 | 1,777 -112 | 162 32 | 50 5 | 112 27 |
| 2020-21 | 3,573 -397 | 3,370 -438 | 1,899 -132 | 1,471 -306 | 203 41 | 64 14 | 139 27 |
| 2021-22 | 4,024 451 | 3,811 441 | 2,015 116 | 1,796 325 | 213 10 | 57 -7 | 156 17 |
| 2022-23 | 4,088 64 | 3,819 8 | 2,009 -6 | 1,810 14 | 269 56 | 67 10 | 202 46 |
| Average | 3,457 | 3,290 | 1,847 | 1,443 | 168 | 84 | 83 |