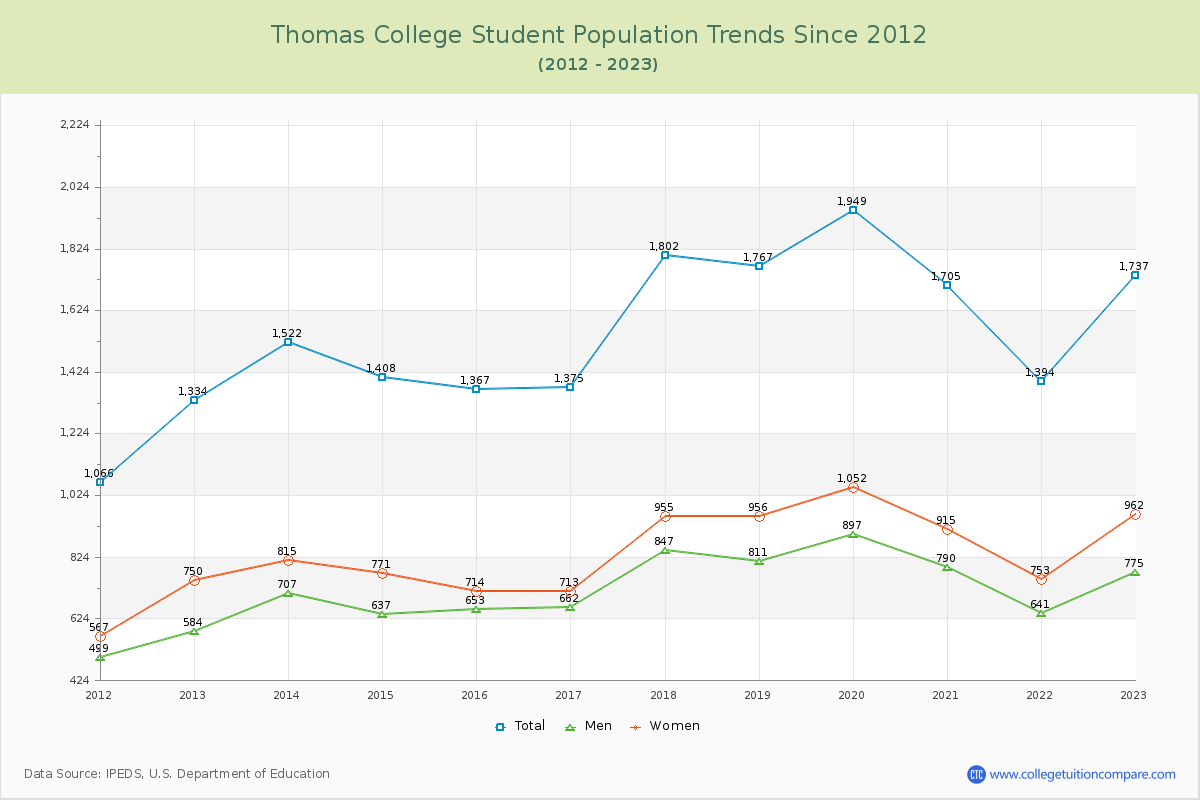
Student Population Changes
The average student population over the last 12 years is 1,578 where 1,737 students are attending the school for the academic year 2022-2023.
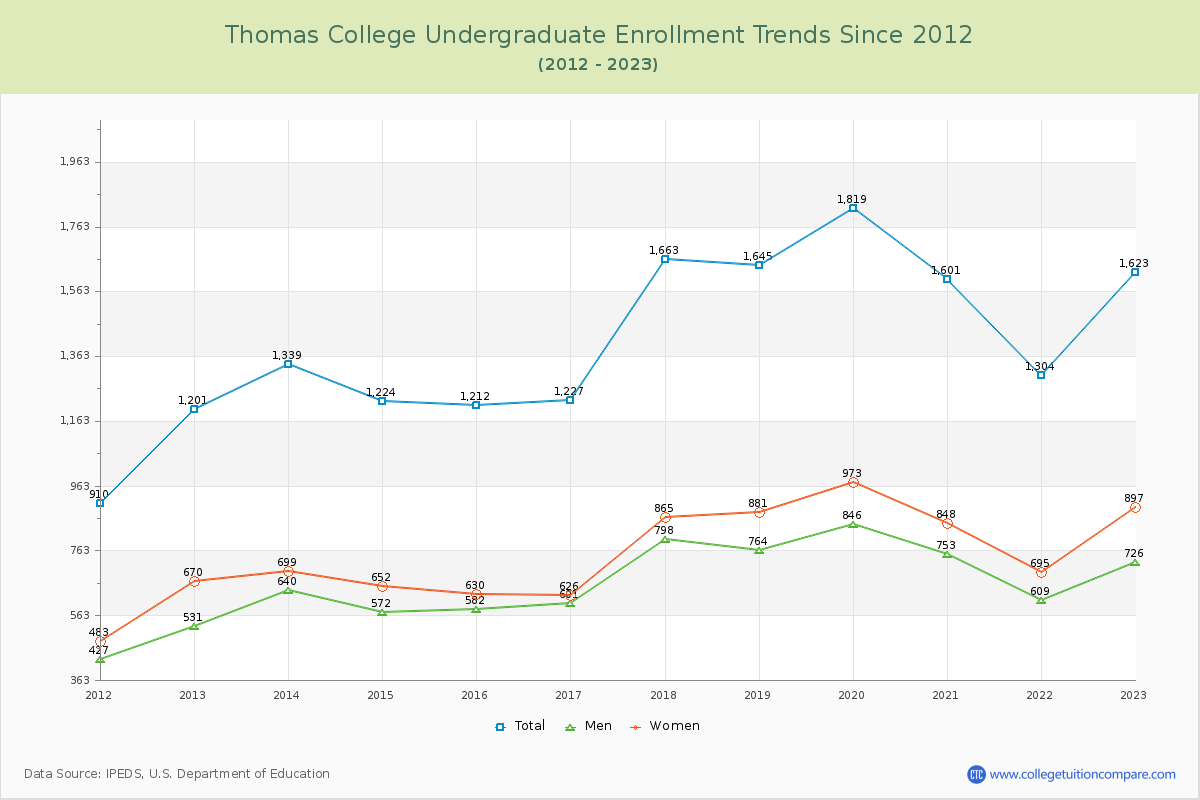
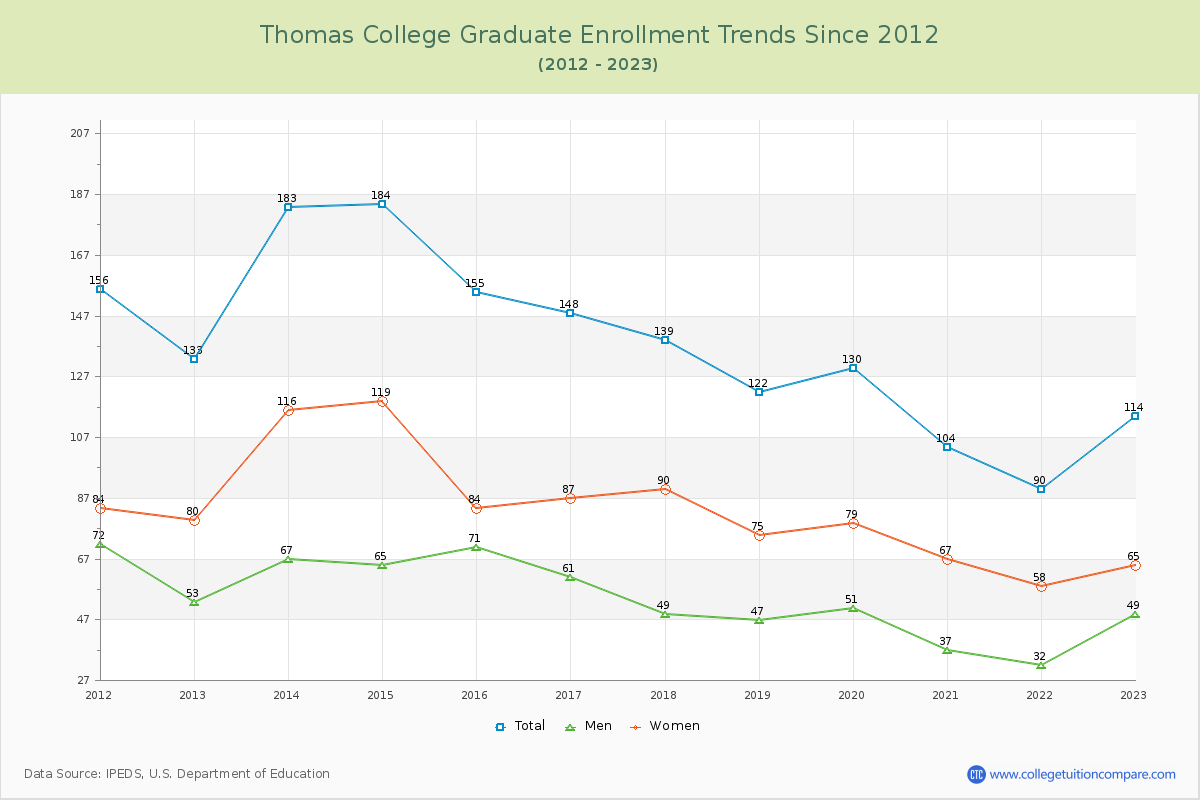
93.44% of total students is undergraduate students and 6.56% students is graduate students. The number of undergraduate students has increased by 422 and the graduate enrollment has decreased by 19 over past 10 years.
The female to male ratio is 1.24 to 1 and it means that there are slightly more female students enrolled in Thomas than male students.
The following table and chart illustrate the changes in student population by gender at Thomas College since 2012.
| Year | Total | Undergraduate | Graduate | ||||
|---|---|---|---|---|---|---|---|
| Total | Men | Women | Total | Men | Women | ||
| 2012-13 | 1,334 | 1,201 | 531 | 670 | 133 | 53 | 80 |
| 2013-14 | 1,522 188 | 1,339 138 | 640 109 | 699 29 | 183 50 | 67 14 | 116 36 |
| 2014-15 | 1,408 -114 | 1,224 -115 | 572 -68 | 652 -47 | 184 1 | 65 -2 | 119 3 |
| 2015-16 | 1,367 -41 | 1,212 -12 | 582 10 | 630 -22 | 155 -29 | 71 6 | 84 -35 |
| 2016-17 | 1,375 8 | 1,227 15 | 601 19 | 626 -4 | 148 -7 | 61 -10 | 87 3 |
| 2017-18 | 1,802 427 | 1,663 436 | 798 197 | 865 239 | 139 -9 | 49 -12 | 90 3 |
| 2018-19 | 1,767 -35 | 1,645 -18 | 764 -34 | 881 16 | 122 -17 | 47 -2 | 75 -15 |
| 2019-20 | 1,949 182 | 1,819 174 | 846 82 | 973 92 | 130 8 | 51 4 | 79 4 |
| 2020-21 | 1,705 -244 | 1,601 -218 | 753 -93 | 848 -125 | 104 -26 | 37 -14 | 67 -12 |
| 2021-22 | 1,394 -311 | 1,304 -297 | 609 -144 | 695 -153 | 90 -14 | 32 -5 | 58 -9 |
| 2022-23 | 1,737 343 | 1,623 319 | 726 117 | 897 202 | 114 24 | 49 17 | 65 7 |
| Average | 1,578 | 1,442 | 675 | 767 | 137 | 53 | 84 |