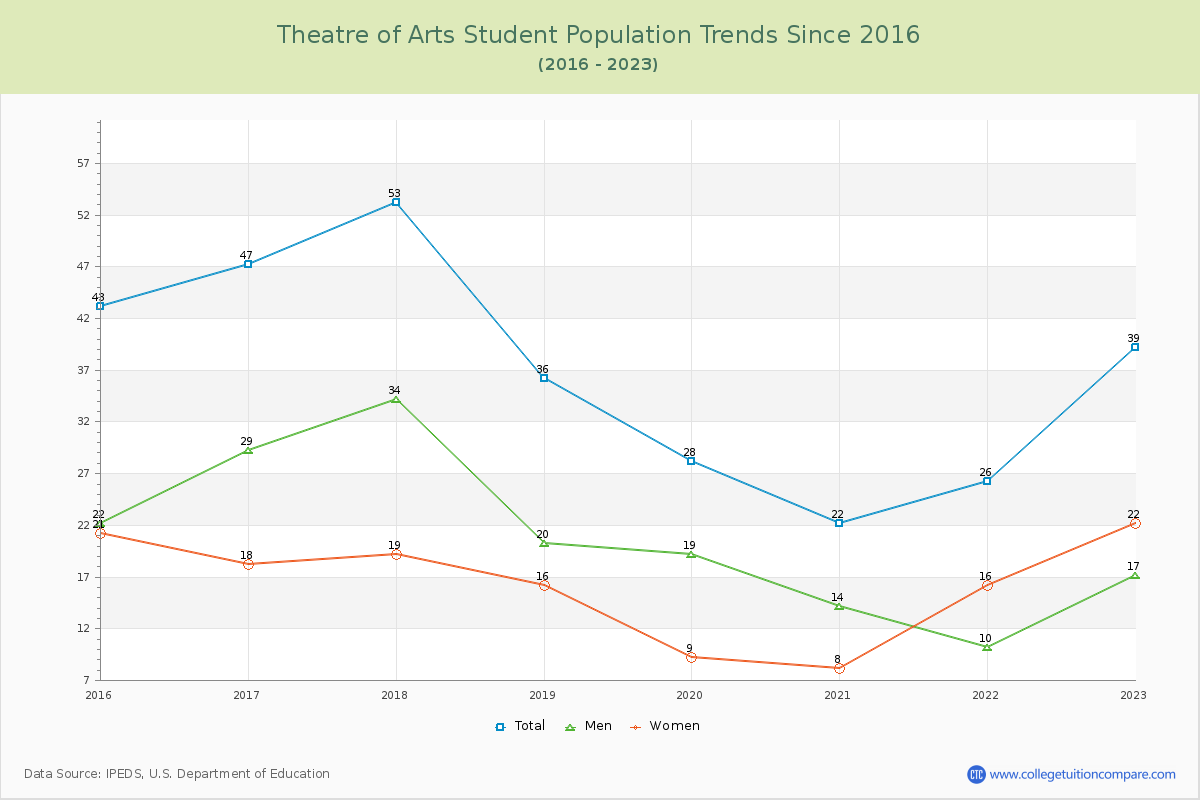
Student Population Changes
The average student population over the last 9 years is 37 where 39 students are attending the school for the academic year 2022-2023.
The female to male ratio is 1.29 to 1 and it means that there are slightly more female students enrolled in TOA than male students.
The following table and chart illustrate the changes in student population by gender at Theatre of Arts since 2015.
| Year | Total | Men | Women |
|---|---|---|---|
| 2015-16 | 43 | 22 | 21 |
| 2016-17 | 47 4 | 29 7 | 18 -3 |
| 2017-18 | 53 6 | 34 5 | 19 1 |
| 2018-19 | 36 -17 | 20 -14 | 16 -3 |
| 2019-20 | 28 -8 | 19 -1 | 9 -7 |
| 2020-21 | 22 -6 | 14 -5 | 8 -1 |
| 2021-22 | 26 4 | 10 -4 | 16 8 |
| 2022-23 | 39 13 | 17 7 | 22 6 |
| Average | 37 | 21 | 16 |