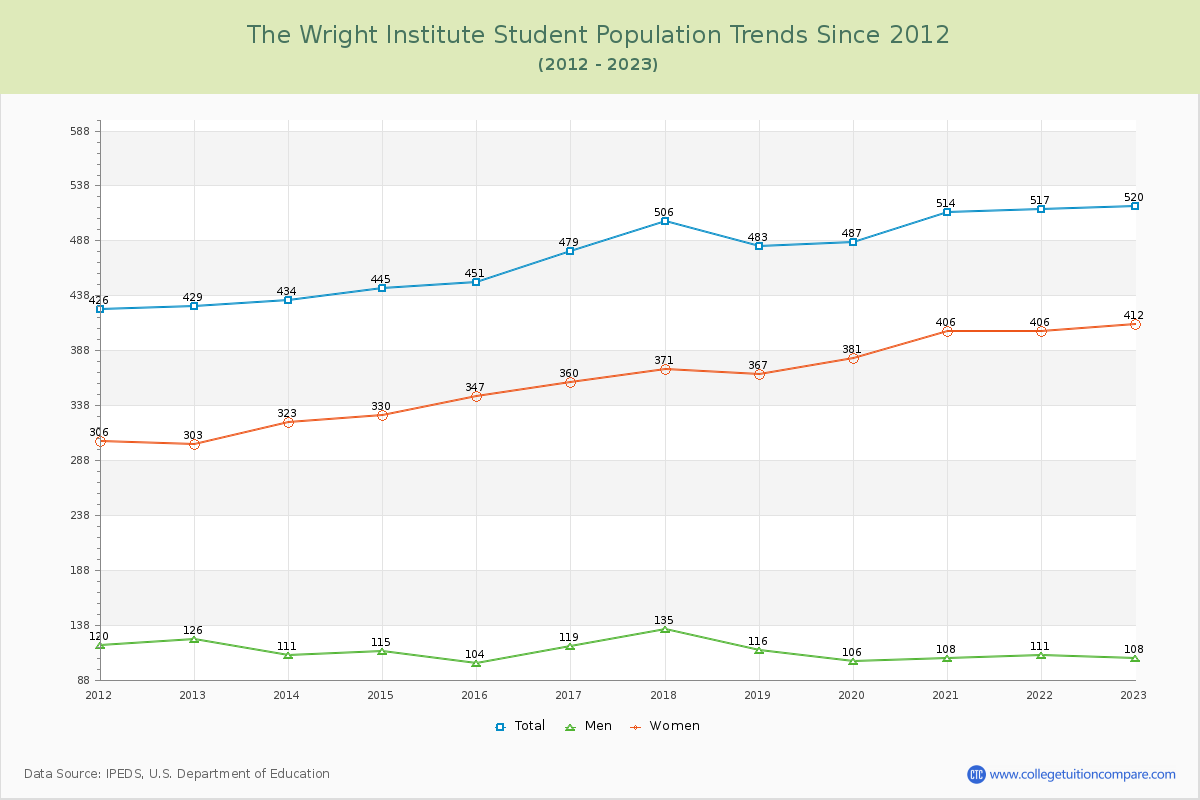
Student Population Changes
The average student population over the last 12 years is 479 where 520 students are attending the school for the academic year 2022-2023.
The female to male ratio is 3.81 to 1 and it means that there are far more female students enrolled in The Wright Institute than male students.
The following table and chart illustrate the changes in student population by gender at The Wright Institute since 2012.
| Year | Total | Men | Women |
|---|---|---|---|
| 2012-13 | 429 | 126 | 303 |
| 2013-14 | 434 5 | 111 -15 | 323 20 |
| 2014-15 | 445 11 | 115 4 | 330 7 |
| 2015-16 | 451 6 | 104 -11 | 347 17 |
| 2016-17 | 479 28 | 119 15 | 360 13 |
| 2017-18 | 506 27 | 135 16 | 371 11 |
| 2018-19 | 483 -23 | 116 -19 | 367 -4 |
| 2019-20 | 487 4 | 106 -10 | 381 14 |
| 2020-21 | 514 27 | 108 2 | 406 25 |
| 2021-22 | 517 3 | 111 3 | 406 0 |
| 2022-23 | 520 3 | 108 -3 | 412 6 |
| Average | 479 | 114 | 364 |