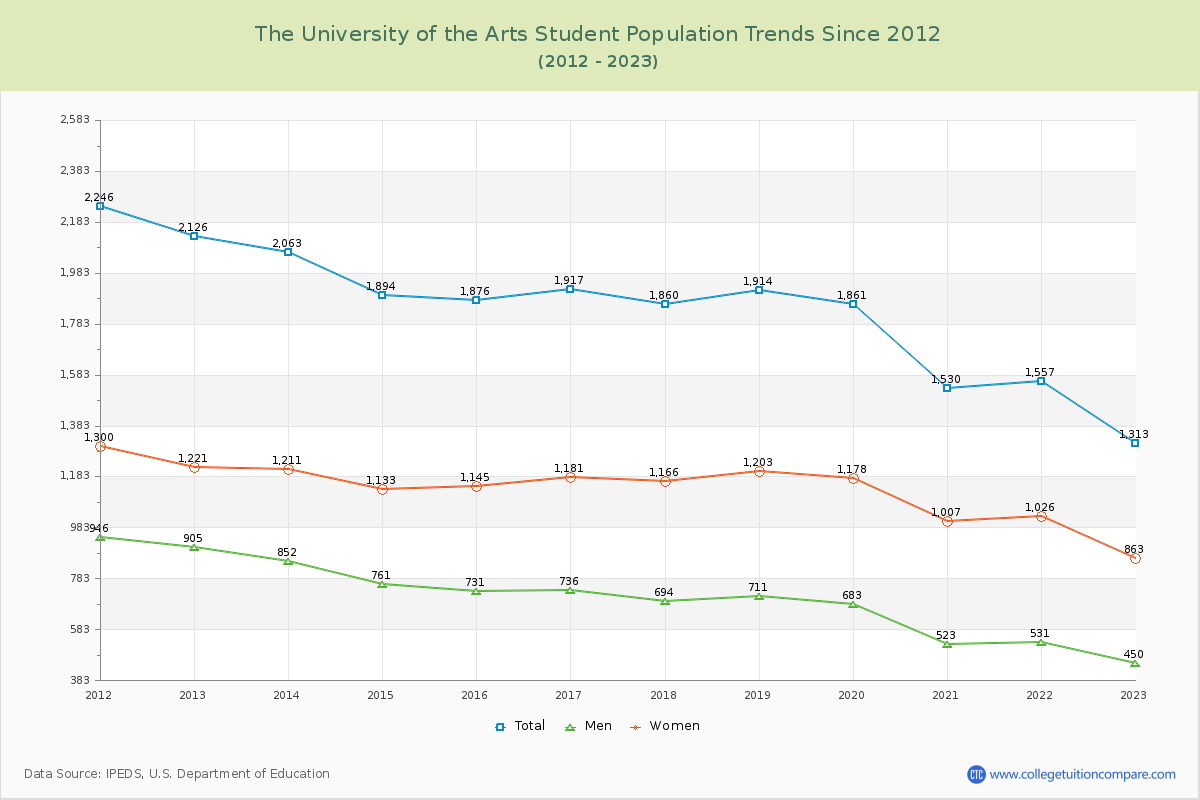
Student Population Changes
The average student population over the last 12 years is 1,810 where 1,313 students are attending the school for the academic year 2022-2023.
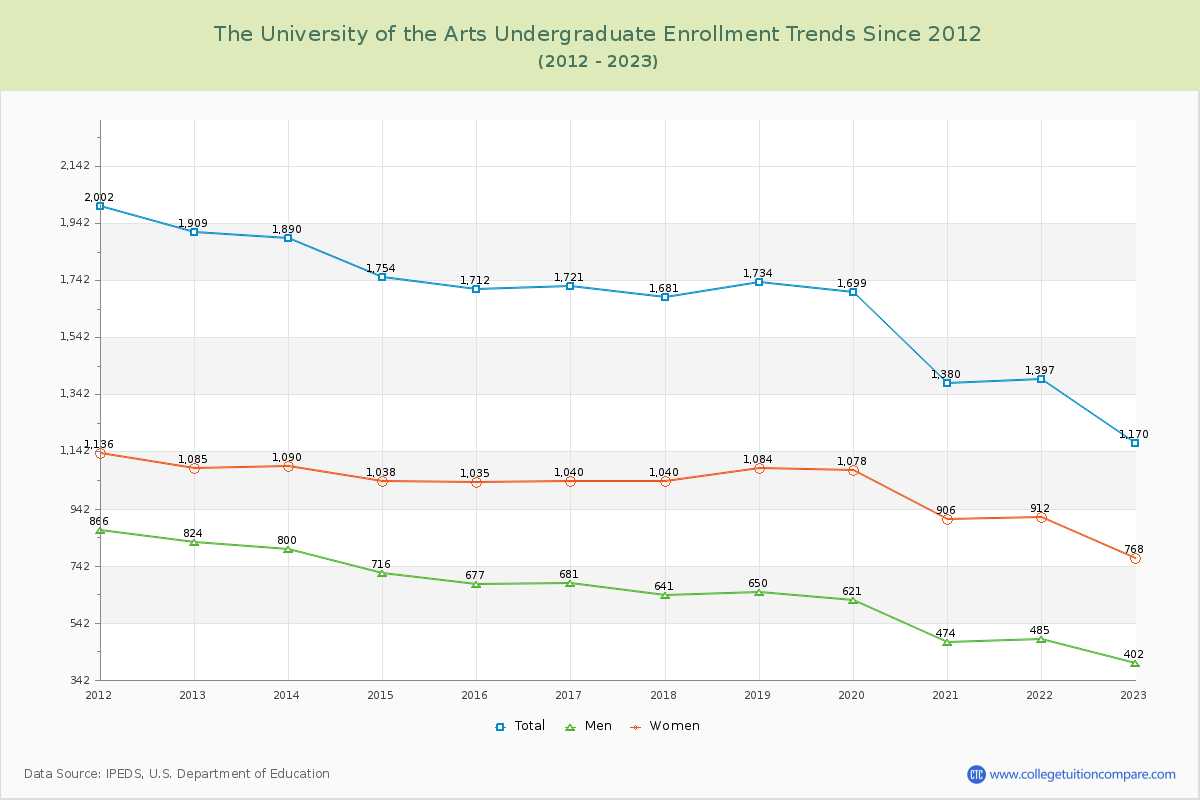
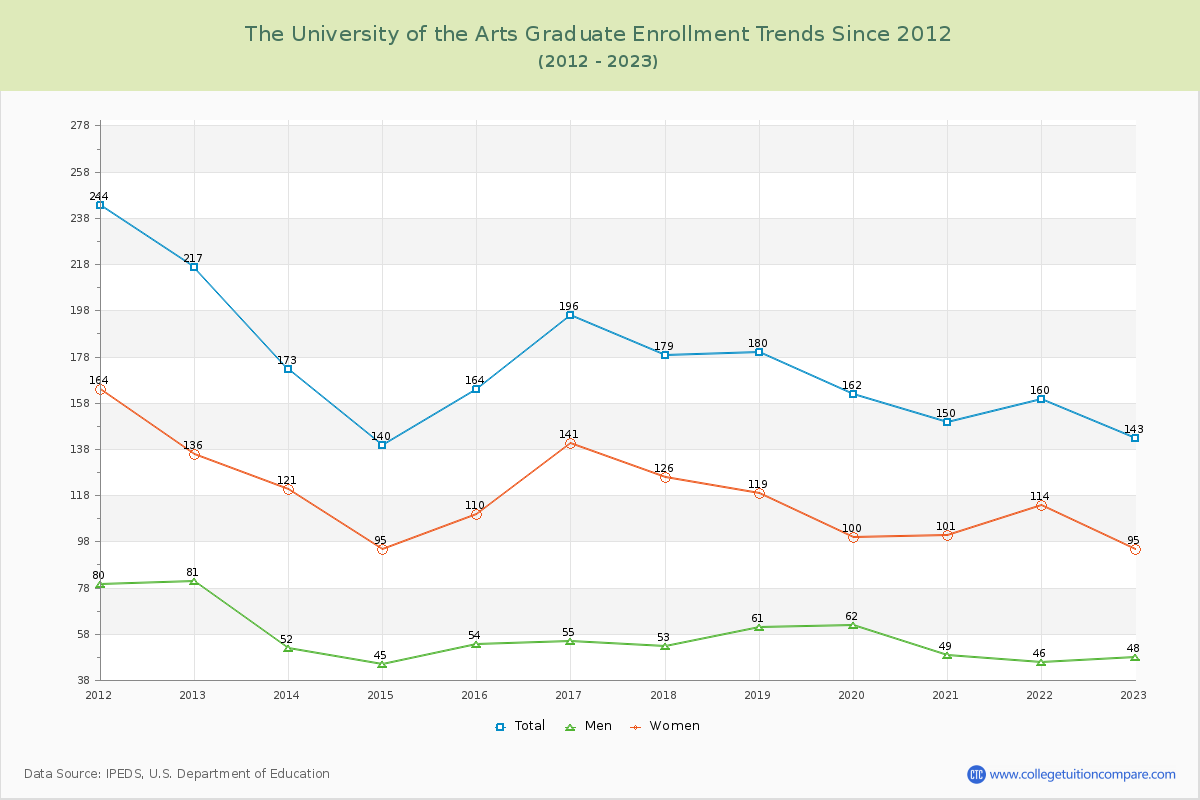
89.11% of total students is undergraduate students and 10.89% students is graduate students. The number of undergraduate students has decreased by 739 and the graduate enrollment has decreased by 74 over past 10 years.
The female to male ratio is 1.92 to 1 and it means that there are more female students enrolled in UArts than male students.
The following table and chart illustrate the changes in student population by gender at The University of the Arts since 2012.
| Year | Total | Undergraduate | Graduate | ||||
|---|---|---|---|---|---|---|---|
| Total | Men | Women | Total | Men | Women | ||
| 2012-13 | 2,126 | 1,909 | 824 | 1,085 | 217 | 81 | 136 |
| 2013-14 | 2,063 -63 | 1,890 -19 | 800 -24 | 1,090 5 | 173 -44 | 52 -29 | 121 -15 |
| 2014-15 | 1,894 -169 | 1,754 -136 | 716 -84 | 1,038 -52 | 140 -33 | 45 -7 | 95 -26 |
| 2015-16 | 1,876 -18 | 1,712 -42 | 677 -39 | 1,035 -3 | 164 24 | 54 9 | 110 15 |
| 2016-17 | 1,917 41 | 1,721 9 | 681 4 | 1,040 5 | 196 32 | 55 1 | 141 31 |
| 2017-18 | 1,860 -57 | 1,681 -40 | 641 -40 | 1,040 0 | 179 -17 | 53 -2 | 126 -15 |
| 2018-19 | 1,914 54 | 1,734 53 | 650 9 | 1,084 44 | 180 1 | 61 8 | 119 -7 |
| 2019-20 | 1,861 -53 | 1,699 -35 | 621 -29 | 1,078 -6 | 162 -18 | 62 1 | 100 -19 |
| 2020-21 | 1,530 -331 | 1,380 -319 | 474 -147 | 906 -172 | 150 -12 | 49 -13 | 101 1 |
| 2021-22 | 1,557 27 | 1,397 17 | 485 11 | 912 6 | 160 10 | 46 -3 | 114 13 |
| 2022-23 | 1,313 -244 | 1,170 -227 | 402 -83 | 768 -144 | 143 -17 | 48 2 | 95 -19 |
| Average | 1,810 | 1,641 | 634 | 1,007 | 169 | 55 | 114 |