Enrollment Trends at UT Permian Basin

-492

Total Enrollment

-410

Men

-82

Women

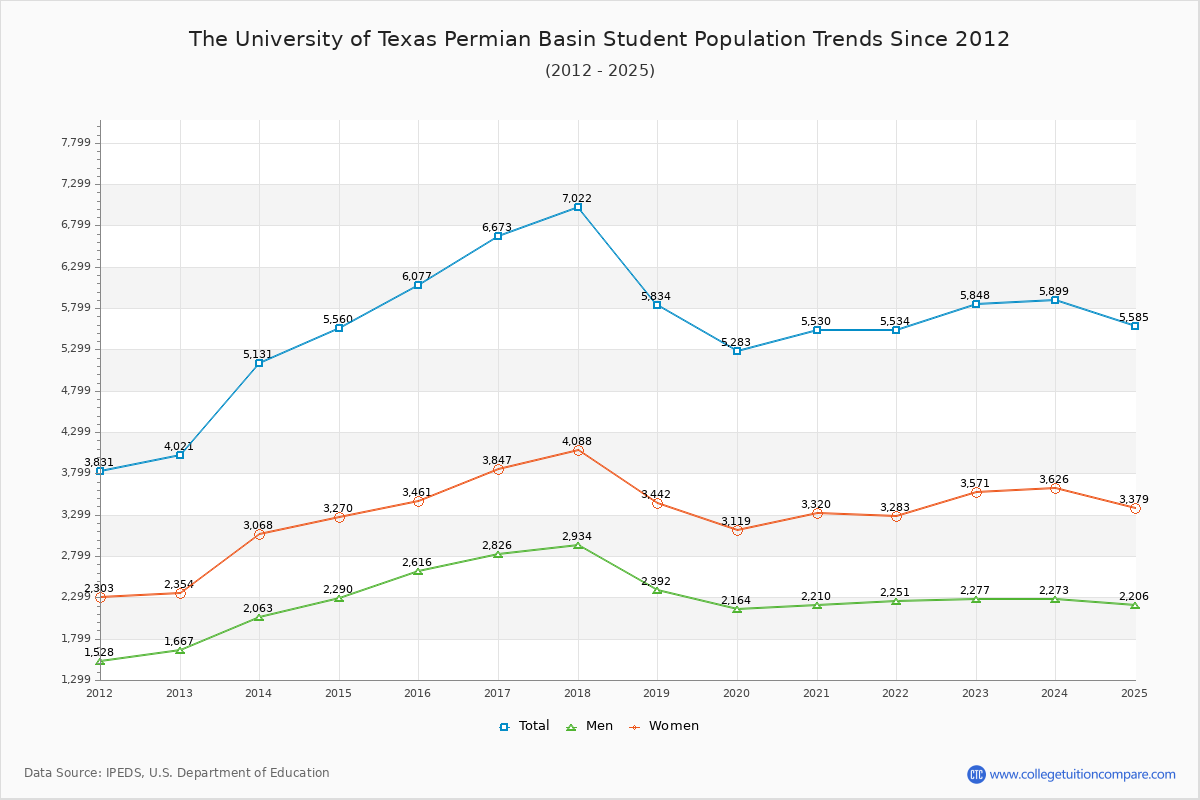
The student population at The University of Texas Permian Basin is 5,585 (4,218 undergraduate and 1,367 graduate students) . The number of students has decreased by 492 over the past decade.

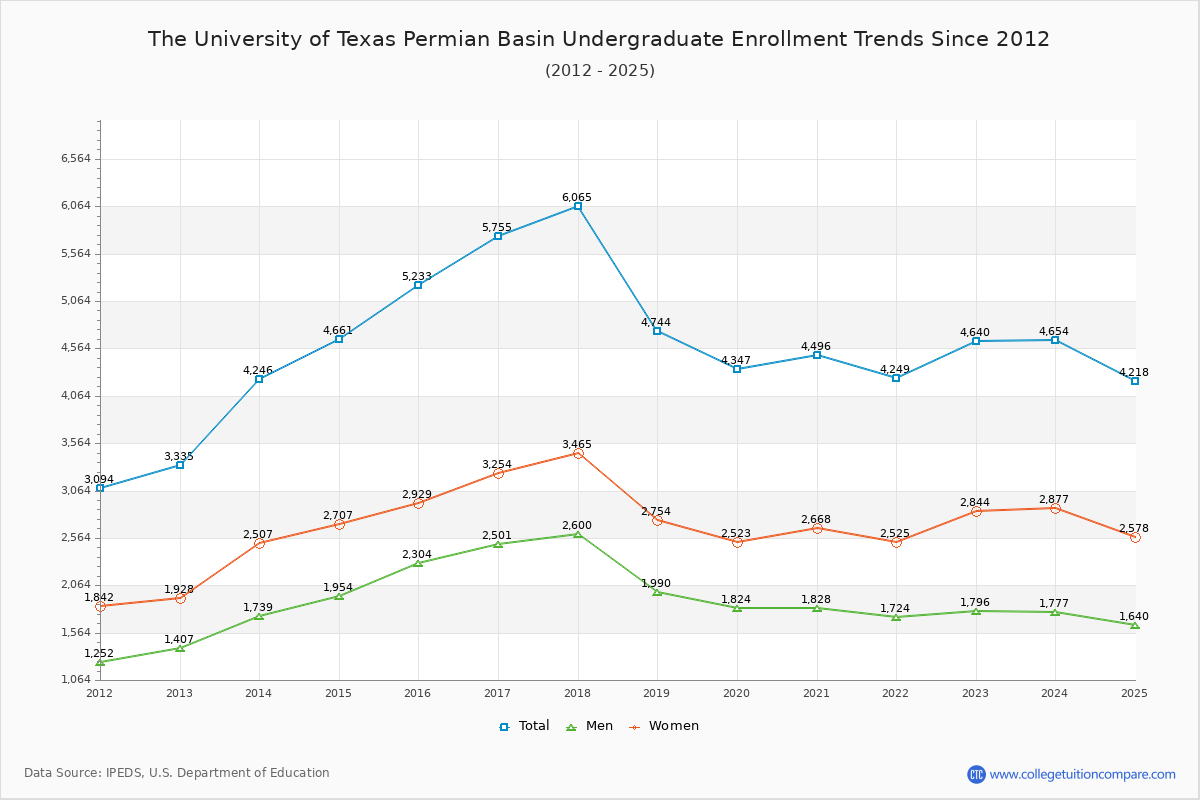
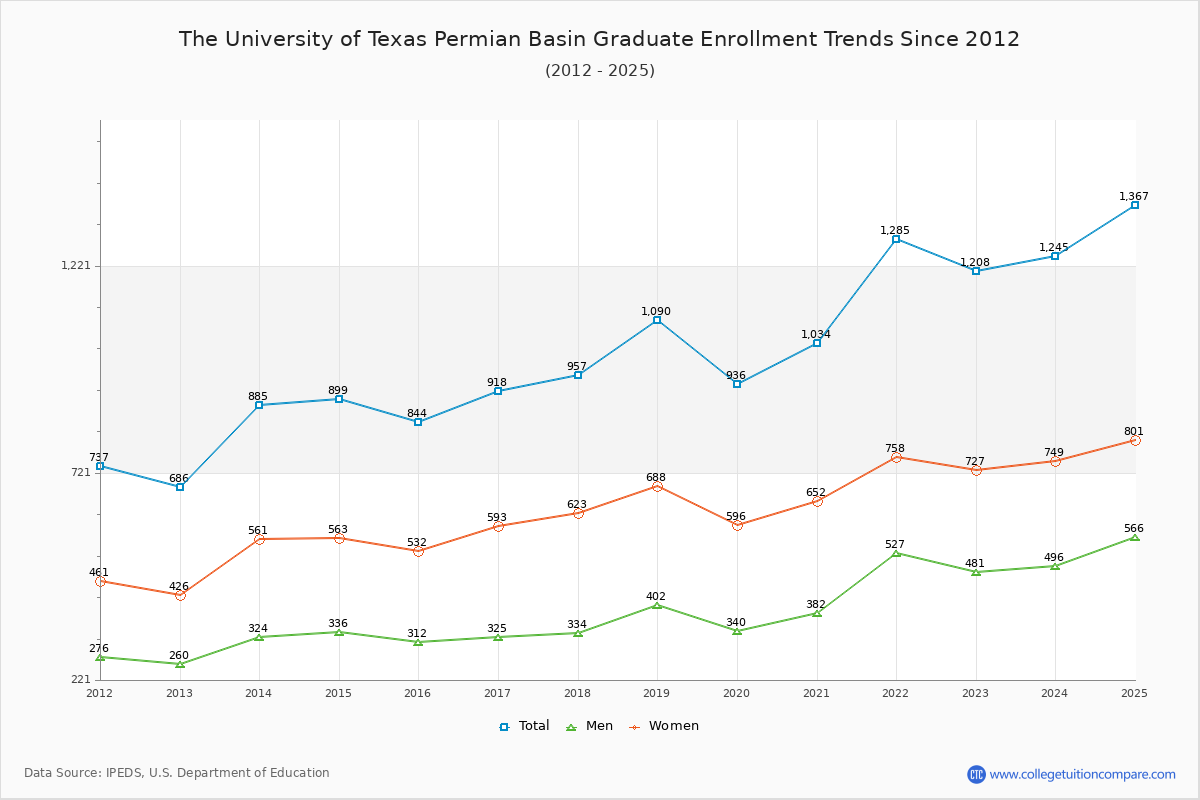
The percentage of undergraduate students at UT Permian Basin is 75.52% which is decreased by 1,015 over last 10 years. The graduate student population increased by 523 and it has been increasing.

The female to male ratio is 1.53 to 1 which means that female students enrolled more than male students.

2,871 students enrolled in online degree program exclusively and the number of online students has increased by 1.16% since 2015.

Student Population Changes

The average student population over the last 11 years is 5,929 where 5,585 students are attending the school for the academic year 2024-2025.

75.52% of total students is undergraduate students and 24.48% students is graduate students. The number of undergraduate students has decreased by 1,015 and the graduate enrollment has increased by 523 over past 10 years.

The female to male ratio is 1.53 to 1 and it means that there are more female students enrolled in UT Permian Basin than male students.

The following table and chart illustrate the changes in student population by gender at The University of Texas Permian Basin since 2015.

YearTotalUndergraduateGraduate
TotalMenWomenTotalMenWomen
2015-166,0775,2332,3042,929844312532
2016-176,673
596
5,755
522
2,501
197
3,254
325
918
74
325
13
593
61
2017-187,022
349
6,065
310
2,600
99
3,465
211
957
39
334
9
623
30
2018-195,834
-1,188
4,744
-1,321
1,990
-610
2,754
-711
1,090
133
402
68
688
65
2019-205,283
-551
4,347
-397
1,824
-166
2,523
-231
936
-154
340
-62
596
-92
2020-215,530
247
4,496
149
1,828
4
2,668
145
1,034
98
382
42
652
56
2021-225,534
4
4,249
-247
1,724
-104
2,525
-143
1,285
251
527
145
758
106
2022-235,848
314
4,640
391
1,796
72
2,844
319
1,208
-77
481
-46
727
-31
2023-245,899
51
4,654
14
1,777
-19
2,877
33
1,245
37
496
15
749
22
2024-255,585
-314
4,218
-436
1,640
-137
2,578
-299
1,367
122
566
70
801
52
Average5,9294,8401,9982,8421,088417672
The University of Texas Permian Basin Enrollment Trends Chart

Undergraduate Enrollment Changes

The average number of Undergraduate students over the last 11 years is 4,840 where 4,218 students are attending the Undergraduate school for the academic year 2024-2025. The following table and chart illustrate the changes in Undergraduate enrollment by attending status and gender at The University of Texas Permian Basin since 2015.

YearTotalFull-timePart-time
TotalMenWomenTotalMenWomen
2015-165,2332,1481,0351,1133,0851,2691,816
2016-175,7552,1861,0311,1553,5691,4702,099
2017-186,0652,1921,0241,1683,8731,5762,297
2018-194,7442,0149741,0402,7301,0161,714
2019-204,3471,8628949682,4859301,555
2020-214,4962,0049051,0992,4929231,569
2021-224,2492,4231,0231,4001,8267011,125
2022-234,6403,0791,1871,8921,561609952
2023-244,6543,2031,2151,9881,451562889
2024-254,2182,9251,1581,7671,293482811
Average4,8404,8401,0451,3594,8409541,483
The University of Texas Permian Basin Undergraduate Enrollment Trends Chart

Graduate Enrollment Changes

The average number of Graduate students over the last 11 years is 1,088 where 1,367 students are attending the Graduate school for the academic year 2024-2025. The following table and chart illustrate the changes in Graduate enrollment by attending status and gender at The University of Texas Permian Basin since 2015.

YearTotalFull-timePart-time
TotalMenWomenTotalMenWomen
2015-1684419510095649212437
2016-179181778988741236505
2017-189571457570812259553
2018-191,0901346074956342614
2019-209361275473809286523
2020-211,0341155758919325594
2021-221,285400175225885352533
2022-231,208356163193852318534
2023-241,245385156229860340520
2024-251,367443181262924385539
Average1,0881,0881111371,088306535
The University of Texas Permian Basin Graduate Enrollment Trends Chart

Enrollment by Race/Ethnicity Changes

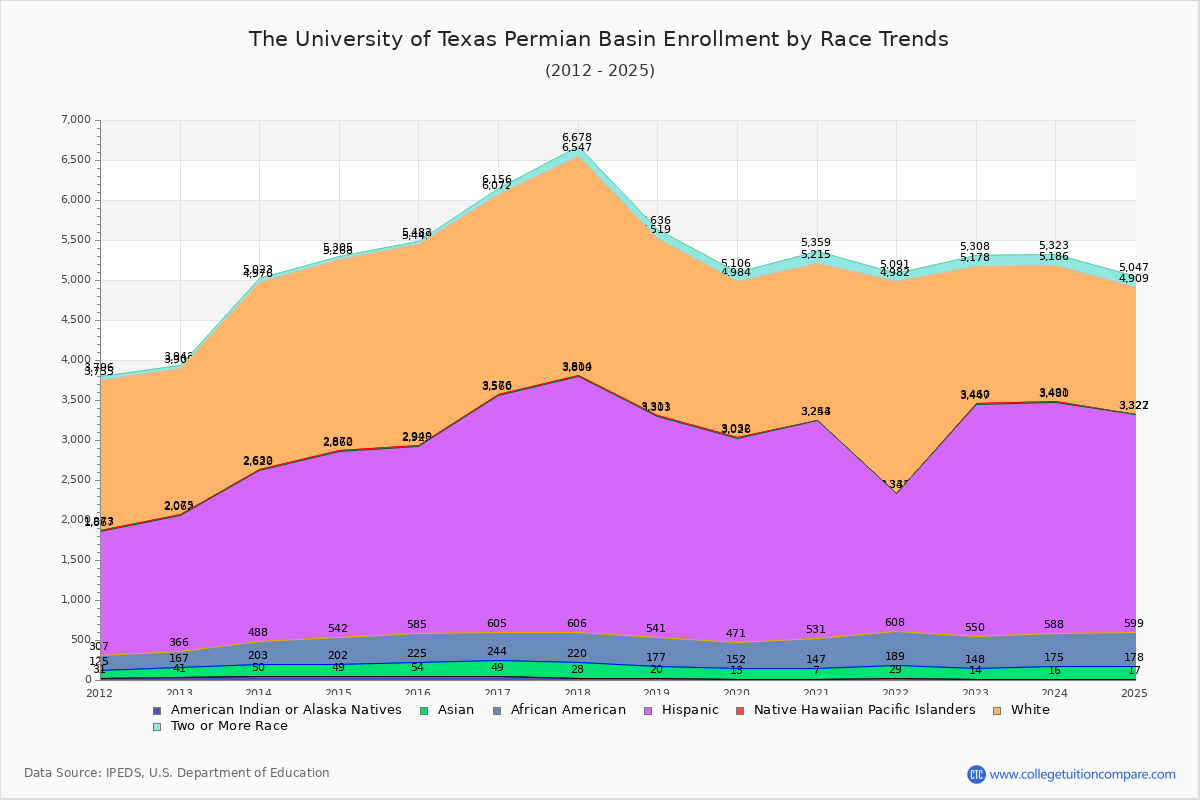
The percentage of white students is 28.33% and the percentage of black students is 7.54% at The University of Texas Permian Basin. 2.88% of enrolled students is Asian. Hispanic students comprise 48.76% of the student body.

Over the past 10 years, the racial composition has shifted. The percentage of white students decreased from 41.29% to 28.33%. Asian enrollment grew from 2.81% to 2.88%. Black student enrollment increased from 5.92% to 7.54%. Hispanic student representation expanded from 38.51% to 48.76%.

The overall racial diversity, measured by the Census Bureau Diversity Index, is 0.6749 which indicates that moderately diverse. This decreased from 0.6769 a decade ago, suggesting that racial diversity has declined.

The following table and chart illustrate the student population trends by race/ethnicity at The University of Texas Permian Basin over the past 11 years (2015-2025).

YearAmerican Indian or Native AmericanAsianBlackHispanicNative Hawaiian or Other Pacific IslanderWhiteTwo or More Races
2015-16541713602,340152,50933
2016-17491953612,955162,49684
2017-18281923863,194142,733131
2018-19201573642,76282,208117
2019-20131393192,55561,952122
2020-2171403842,71391,962144
2021-22291604191,72682,640109
2022-23141344022,897131,718130
2023-24161594132,892111,695137
2024-25171614212,72351,582138
Average251613832,676112,150115
The University of Texas Permian Basin Enrollment by Race Trends Chart

Distance Learning (Online Courses) Enrollment Changes

2,871 students are enrolled in online degree programs exclusively for the academic year 2024-2025, which is 52% of total students. The number of online students has increased 1.16% since 2015. The following table and chart illustrate the changes in the online student population by enrolled type at The University of Texas Permian Basin from 2015 to 2025.

YearTotal EnrollmentOnline CompletelyEnrolled in Some Online CoursesNot Enrolled in Online Courses
2015-166,0772,8381,2322,007
2016-176,6733,3271,2052,141
2017-187,0223,7521,4411,829
2018-195,8342,8791,2901,665
2019-205,2832,4161,3061,561
2020-215,5302,7002,111719
2021-225,5342,8871,6021,045
2022-235,8482,8602,105883
2023-245,8992,8572,189853
2024-255,5852,8711,917797
Average5,9292,9391,6401,350

Ratings & Review

Share your experiences and thoughts about The University of Texas Permian Basin. It will be a great help to applicants and prospective students!