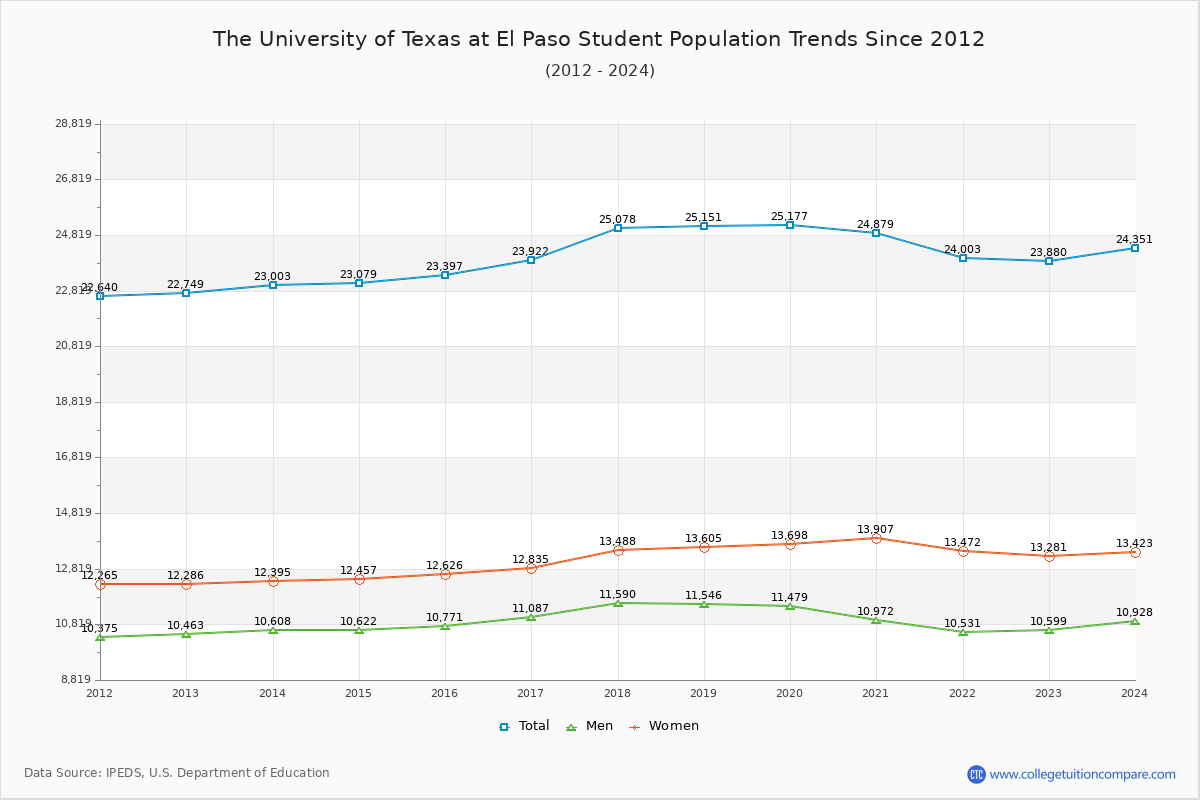
Student Population Changes
The average student population over the last 12 years is 24,029 where 23,880 students are attending the school for the academic year 2022-2023.
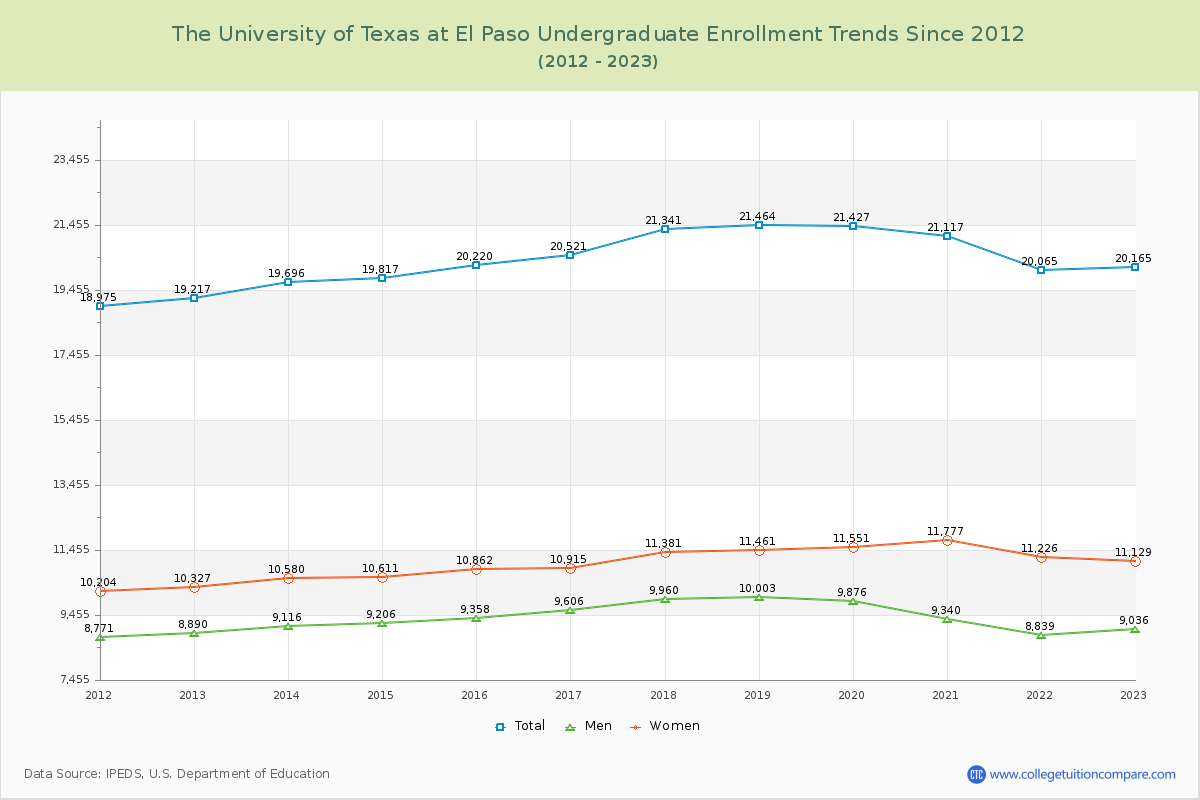
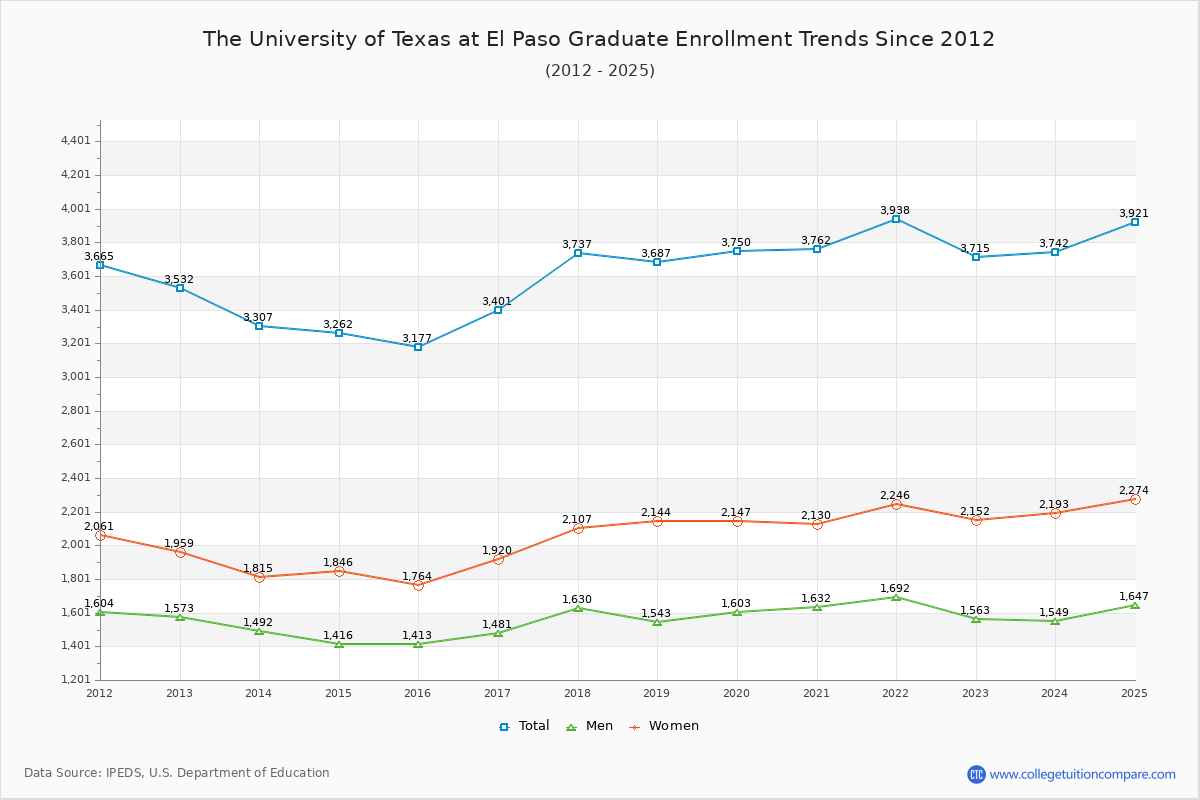
84.44% of total students is undergraduate students and 15.56% students is graduate students. The number of undergraduate students has increased by 948 and the graduate enrollment has increased by 183 over past 10 years.
The female to male ratio is 1.25 to 1 and it means that there are slightly more female students enrolled in UTEP than male students.
The following table and chart illustrate the changes in student population by gender at The University of Texas at El Paso since 2012.
| Year | Total | Undergraduate | Graduate | ||||
|---|---|---|---|---|---|---|---|
| Total | Men | Women | Total | Men | Women | ||
| 2012-13 | 22,749 | 19,217 | 8,890 | 10,327 | 3,532 | 1,573 | 1,959 |
| 2013-14 | 23,003 254 | 19,696 479 | 9,116 226 | 10,580 253 | 3,307 -225 | 1,492 -81 | 1,815 -144 |
| 2014-15 | 23,079 76 | 19,817 121 | 9,206 90 | 10,611 31 | 3,262 -45 | 1,416 -76 | 1,846 31 |
| 2015-16 | 23,397 318 | 20,220 403 | 9,358 152 | 10,862 251 | 3,177 -85 | 1,413 -3 | 1,764 -82 |
| 2016-17 | 23,922 525 | 20,521 301 | 9,606 248 | 10,915 53 | 3,401 224 | 1,481 68 | 1,920 156 |
| 2017-18 | 25,078 1,156 | 21,341 820 | 9,960 354 | 11,381 466 | 3,737 336 | 1,630 149 | 2,107 187 |
| 2018-19 | 25,151 73 | 21,464 123 | 10,003 43 | 11,461 80 | 3,687 -50 | 1,543 -87 | 2,144 37 |
| 2019-20 | 25,177 26 | 21,427 -37 | 9,876 -127 | 11,551 90 | 3,750 63 | 1,603 60 | 2,147 3 |
| 2020-21 | 24,879 -298 | 21,117 -310 | 9,340 -536 | 11,777 226 | 3,762 12 | 1,632 29 | 2,130 -17 |
| 2021-22 | 24,003 -876 | 20,065 -1,052 | 8,839 -501 | 11,226 -551 | 3,938 176 | 1,692 60 | 2,246 116 |
| 2022-23 | 23,880 -123 | 20,165 100 | 9,036 197 | 11,129 -97 | 3,715 -223 | 1,563 -129 | 2,152 -94 |
| Average | 24,029 | 20,459 | 9,385 | 11,075 | 3,570 | 1,549 | 2,021 |