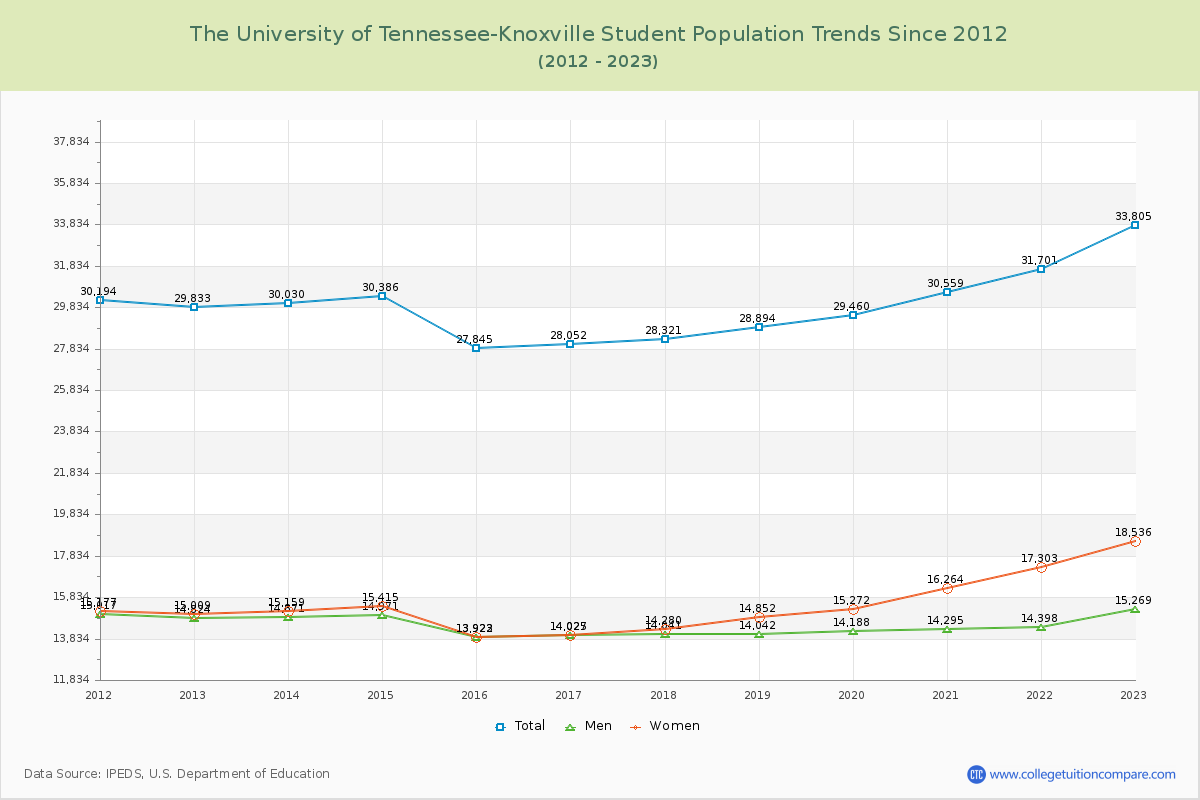
Student Population Changes
The average student population over the last 12 years is 29,899 where 33,805 students are attending the school for the academic year 2022-2023.
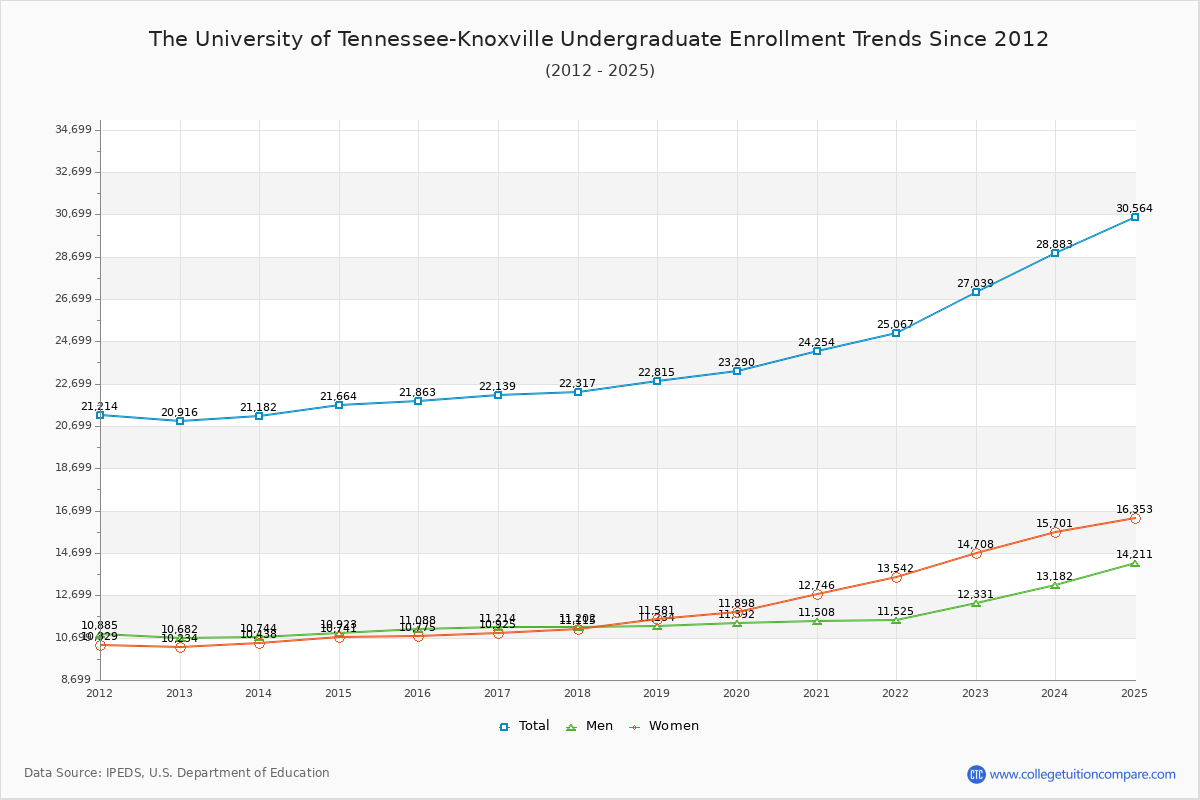
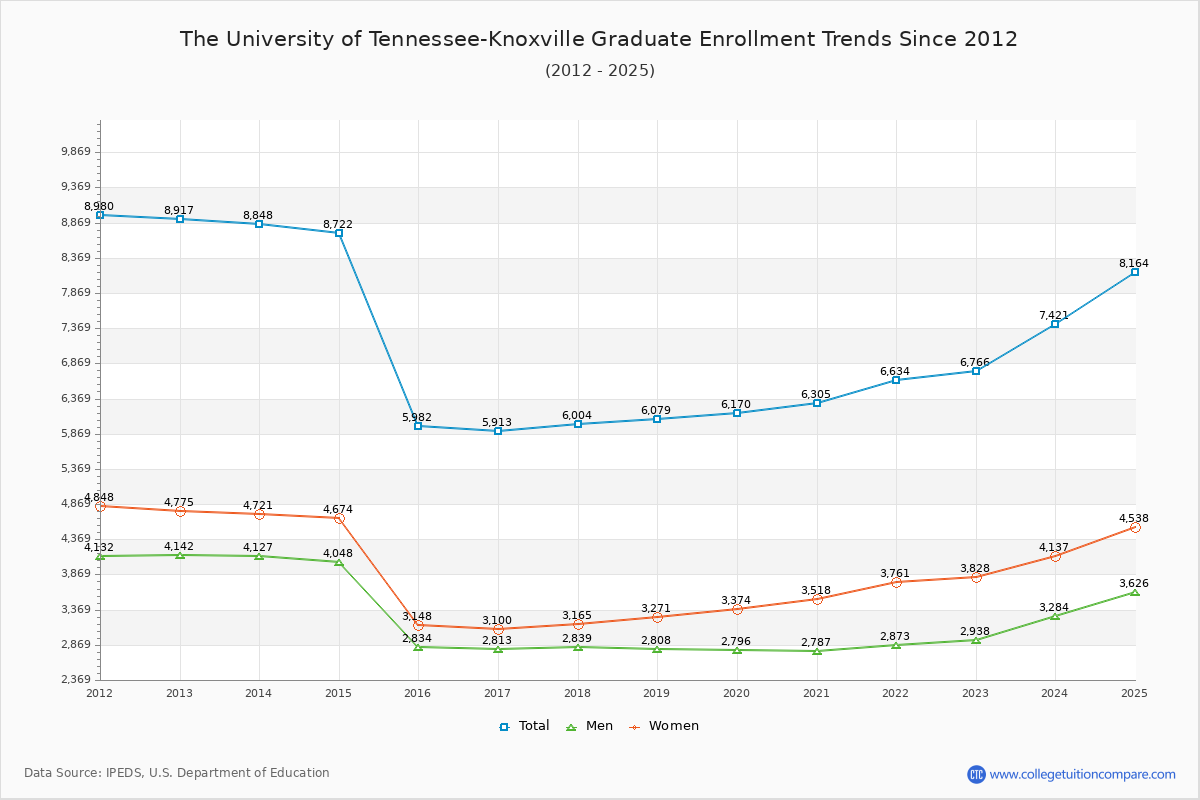
79.99% of total students is undergraduate students and 20.01% students is graduate students. The number of undergraduate students has increased by 6,123 and the graduate enrollment has decreased by 2,151 over past 10 years.
The female to male ratio is 1.21 to 1 and it means that there are slightly more female students enrolled in UTK than male students.
The following table and chart illustrate the changes in student population by gender at The University of Tennessee-Knoxville since 2012.
| Year | Total | Undergraduate | Graduate | ||||
|---|---|---|---|---|---|---|---|
| Total | Men | Women | Total | Men | Women | ||
| 2012-13 | 29,833 | 20,916 | 10,682 | 10,234 | 8,917 | 4,142 | 4,775 |
| 2013-14 | 30,030 197 | 21,182 266 | 10,744 62 | 10,438 204 | 8,848 -69 | 4,127 -15 | 4,721 -54 |
| 2014-15 | 30,386 356 | 21,664 482 | 10,923 179 | 10,741 303 | 8,722 -126 | 4,048 -79 | 4,674 -47 |
| 2015-16 | 27,845 -2,541 | 21,863 199 | 11,088 165 | 10,775 34 | 5,982 -2,740 | 2,834 -1,214 | 3,148 -1,526 |
| 2016-17 | 28,052 207 | 22,139 276 | 11,214 126 | 10,925 150 | 5,913 -69 | 2,813 -21 | 3,100 -48 |
| 2017-18 | 28,321 269 | 22,317 178 | 11,202 -12 | 11,115 190 | 6,004 91 | 2,839 26 | 3,165 65 |
| 2018-19 | 28,894 573 | 22,815 498 | 11,234 32 | 11,581 466 | 6,079 75 | 2,808 -31 | 3,271 106 |
| 2019-20 | 29,460 566 | 23,290 475 | 11,392 158 | 11,898 317 | 6,170 91 | 2,796 -12 | 3,374 103 |
| 2020-21 | 30,559 1,099 | 24,254 964 | 11,508 116 | 12,746 848 | 6,305 135 | 2,787 -9 | 3,518 144 |
| 2021-22 | 31,701 1,142 | 25,067 813 | 11,525 17 | 13,542 796 | 6,634 329 | 2,873 86 | 3,761 243 |
| 2022-23 | 33,805 2,104 | 27,039 1,972 | 12,331 806 | 14,708 1,166 | 6,766 132 | 2,938 65 | 3,828 67 |
| Average | 29,899 | 22,959 | 11,258 | 11,700 | 6,940 | 3,182 | 3,758 |