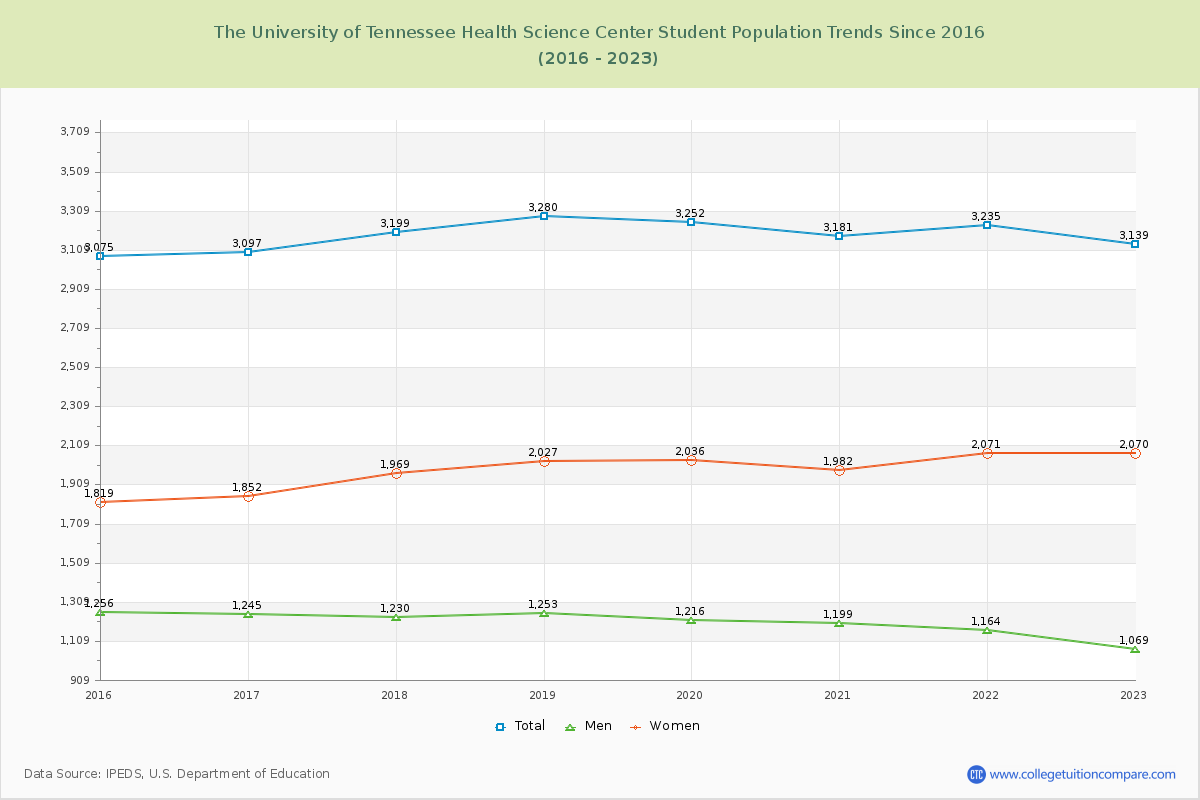
Student Population Changes
The average student population over the last 9 years is 3,182 where 3,139 students are attending the school for the academic year 2022-2023.
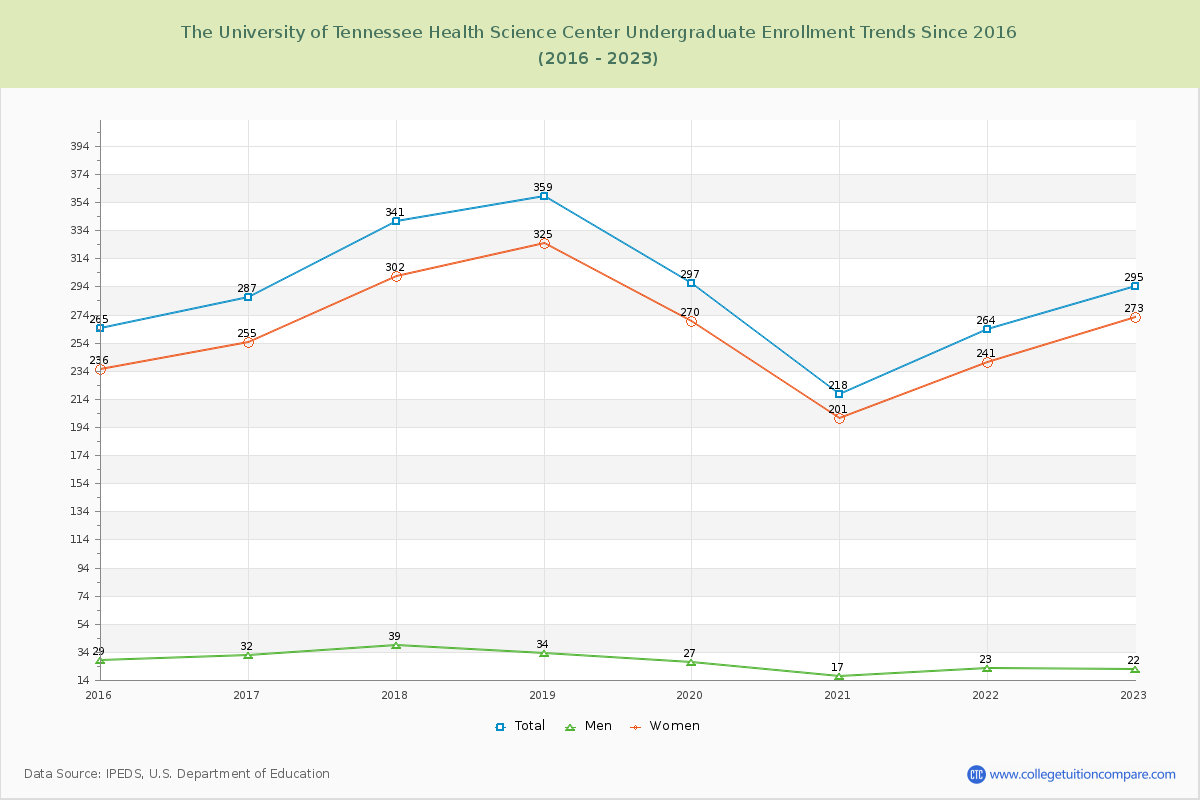
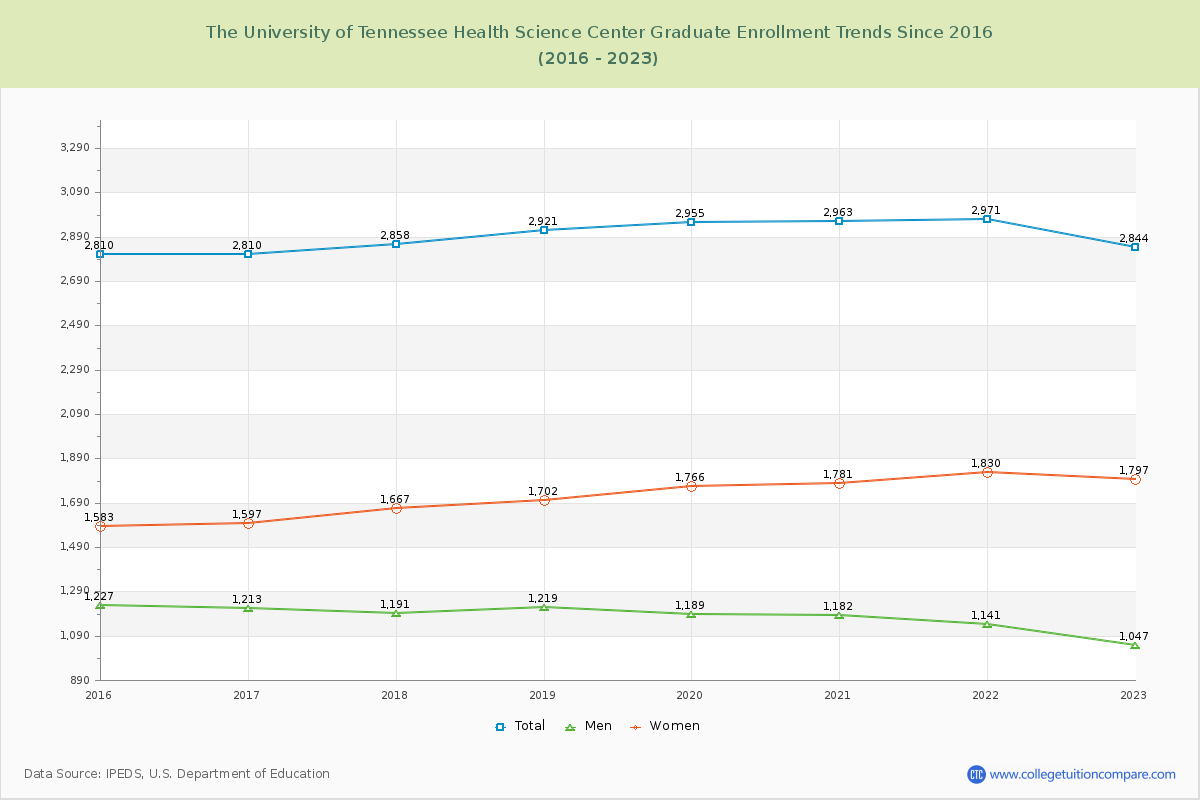
9.40% of total students is undergraduate students and 90.60% students is graduate students. The number of undergraduate students has increased by 30 and the graduate enrollment has increased by 34 over past 10 years.
The female to male ratio is 1.94 to 1 and it means that there are more female students enrolled in UTHSC than male students.
The following table and chart illustrate the changes in student population by gender at The University of Tennessee Health Science Center since 2015.
| Year | Total | Undergraduate | Graduate | ||||
|---|---|---|---|---|---|---|---|
| Total | Men | Women | Total | Men | Women | ||
| 2015-16 | 3,075 | 265 | 29 | 236 | 2,810 | 1,227 | 1,583 |
| 2016-17 | 3,097 22 | 287 22 | 32 3 | 255 19 | 2,810 0 | 1,213 -14 | 1,597 14 |
| 2017-18 | 3,199 102 | 341 54 | 39 7 | 302 47 | 2,858 48 | 1,191 -22 | 1,667 70 |
| 2018-19 | 3,280 81 | 359 18 | 34 -5 | 325 23 | 2,921 63 | 1,219 28 | 1,702 35 |
| 2019-20 | 3,252 -28 | 297 -62 | 27 -7 | 270 -55 | 2,955 34 | 1,189 -30 | 1,766 64 |
| 2020-21 | 3,181 -71 | 218 -79 | 17 -10 | 201 -69 | 2,963 8 | 1,182 -7 | 1,781 15 |
| 2021-22 | 3,235 54 | 264 46 | 23 6 | 241 40 | 2,971 8 | 1,141 -41 | 1,830 49 |
| 2022-23 | 3,139 -96 | 295 31 | 22 -1 | 273 32 | 2,844 -127 | 1,047 -94 | 1,797 -33 |
| Average | 3,182 | 291 | 28 | 263 | 2,892 | 1,176 | 1,715 |