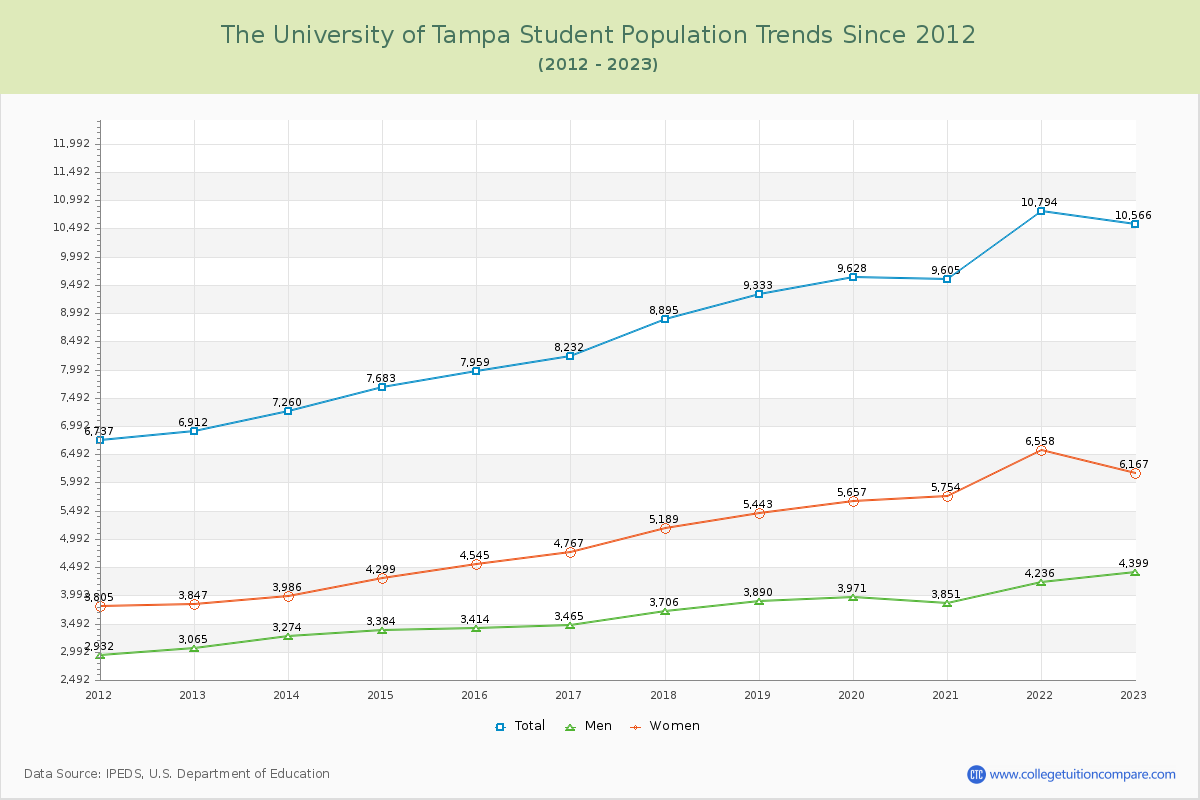
Student Population Changes
The average student population over the last 12 years is 8,806 where 10,566 students are attending the school for the academic year 2022-2023.
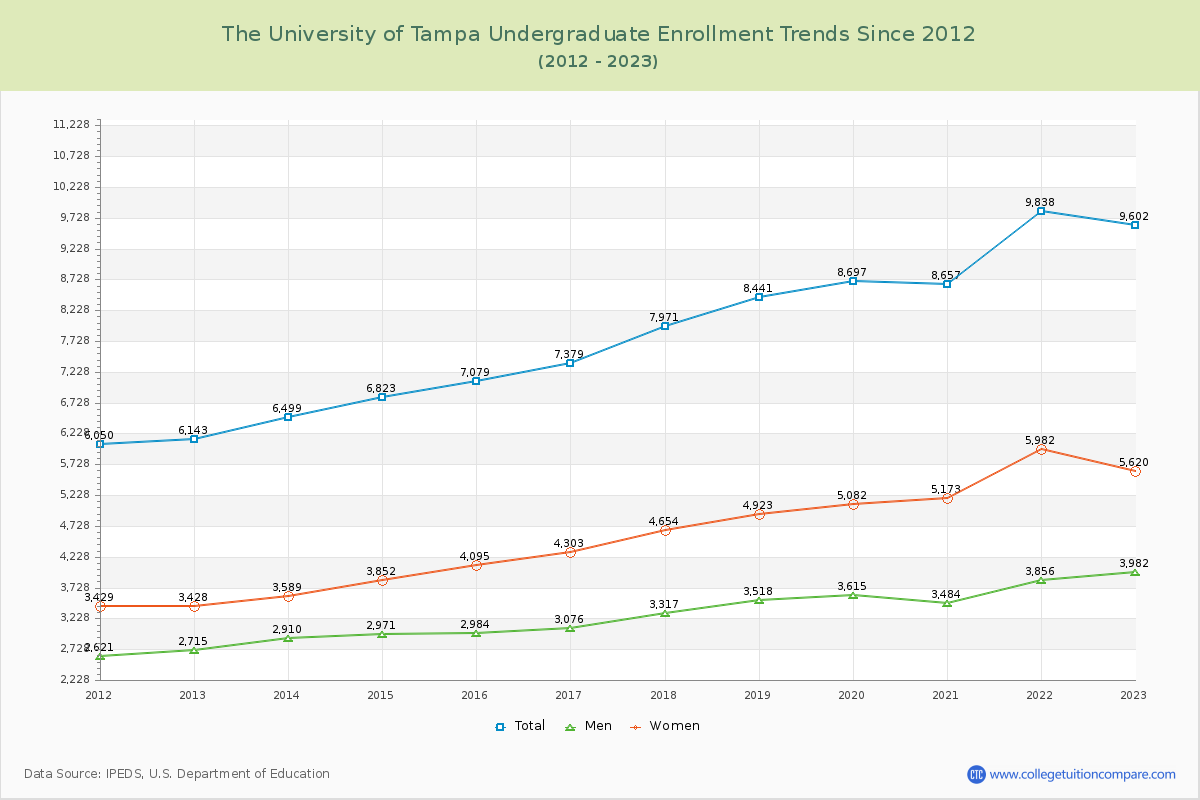
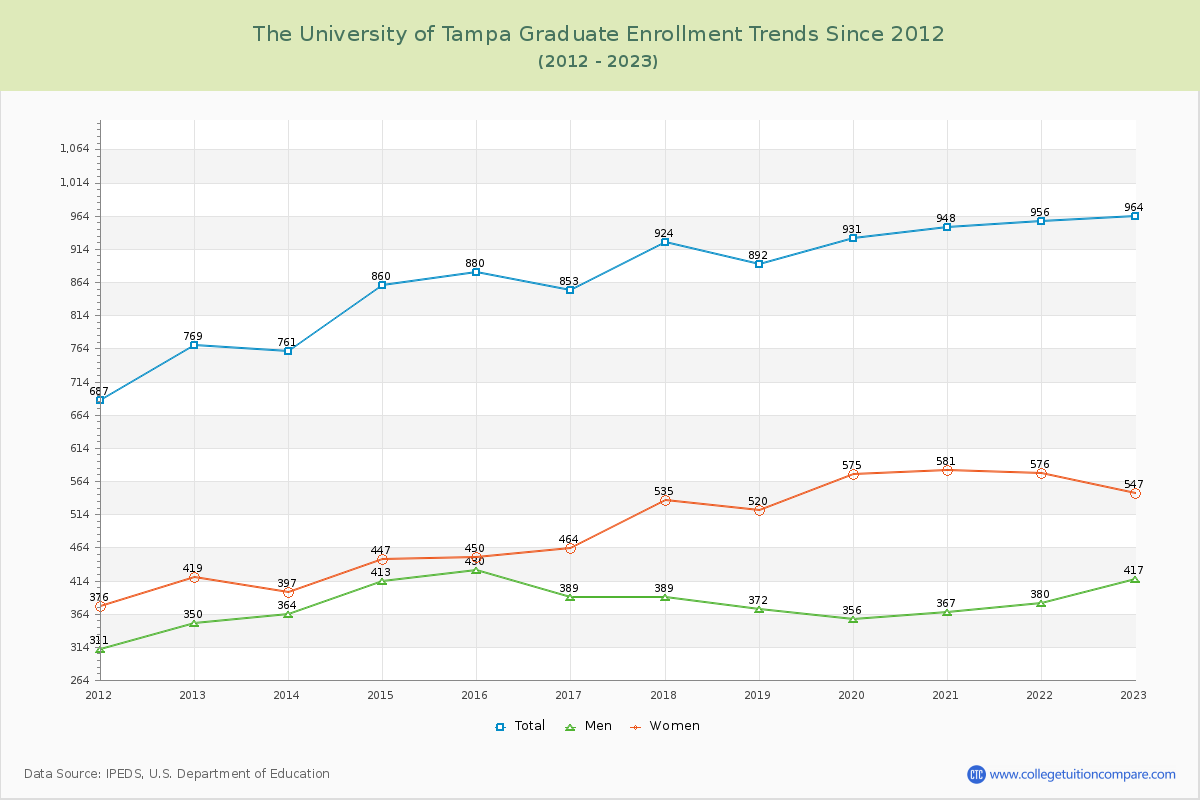
90.88% of total students is undergraduate students and 9.12% students is graduate students. The number of undergraduate students has increased by 3,459 and the graduate enrollment has increased by 195 over past 10 years.
The female to male ratio is 1.40 to 1 and it means that there are more female students enrolled in The University of Tampa than male students.
The following table and chart illustrate the changes in student population by gender at The University of Tampa since 2012.
| Year | Total | Undergraduate | Graduate | ||||
|---|---|---|---|---|---|---|---|
| Total | Men | Women | Total | Men | Women | ||
| 2012-13 | 6,912 | 6,143 | 2,715 | 3,428 | 769 | 350 | 419 |
| 2013-14 | 7,260 348 | 6,499 356 | 2,910 195 | 3,589 161 | 761 -8 | 364 14 | 397 -22 |
| 2014-15 | 7,683 423 | 6,823 324 | 2,971 61 | 3,852 263 | 860 99 | 413 49 | 447 50 |
| 2015-16 | 7,959 276 | 7,079 256 | 2,984 13 | 4,095 243 | 880 20 | 430 17 | 450 3 |
| 2016-17 | 8,232 273 | 7,379 300 | 3,076 92 | 4,303 208 | 853 -27 | 389 -41 | 464 14 |
| 2017-18 | 8,895 663 | 7,971 592 | 3,317 241 | 4,654 351 | 924 71 | 389 0 | 535 71 |
| 2018-19 | 9,333 438 | 8,441 470 | 3,518 201 | 4,923 269 | 892 -32 | 372 -17 | 520 -15 |
| 2019-20 | 9,628 295 | 8,697 256 | 3,615 97 | 5,082 159 | 931 39 | 356 -16 | 575 55 |
| 2020-21 | 9,605 -23 | 8,657 -40 | 3,484 -131 | 5,173 91 | 948 17 | 367 11 | 581 6 |
| 2021-22 | 10,794 1,189 | 9,838 1,181 | 3,856 372 | 5,982 809 | 956 8 | 380 13 | 576 -5 |
| 2022-23 | 10,566 -228 | 9,602 -236 | 3,982 126 | 5,620 -362 | 964 8 | 417 37 | 547 -29 |
| Average | 8,806 | 7,921 | 3,312 | 4,609 | 885 | 384 | 501 |