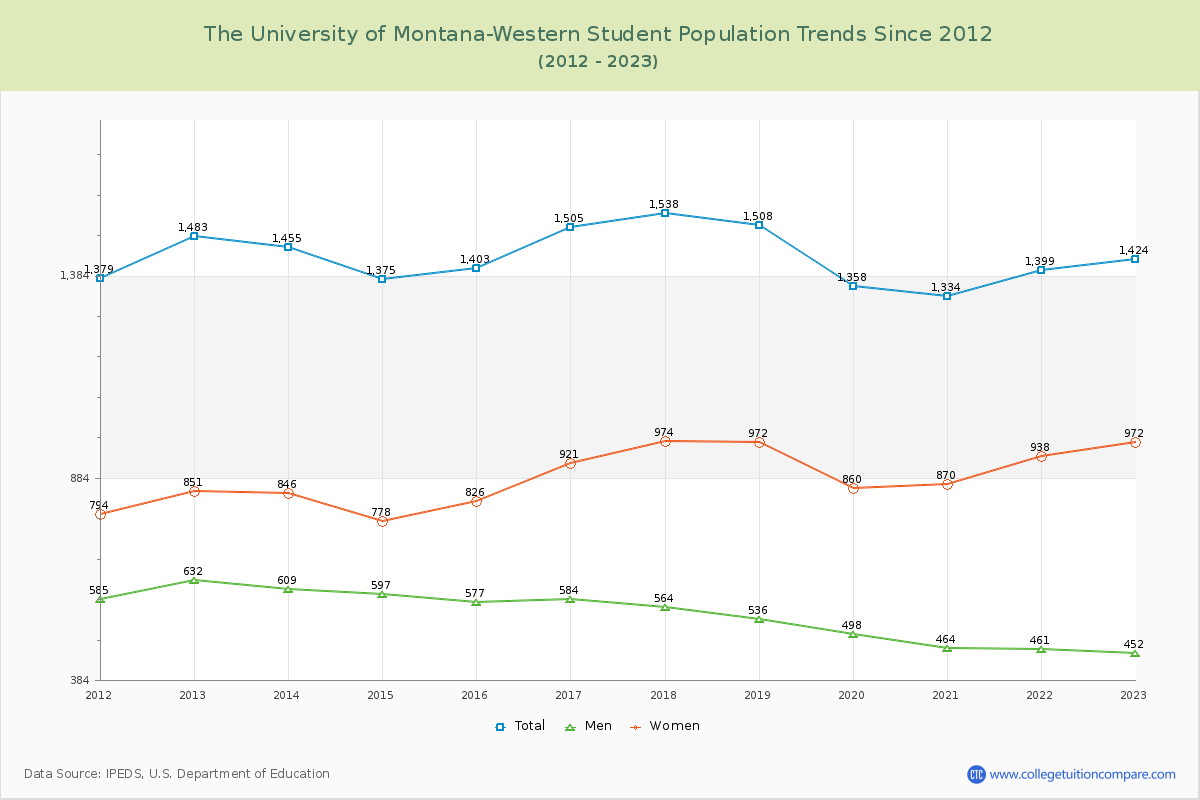
Student Population Changes
The average student population over the last 12 years is 1,435 where 1,424 students are attending the school for the academic year 2022-2023.
The female to male ratio is 2.15 to 1 and it means that there are far more female students enrolled in WMC than male students.
The following table and chart illustrate the changes in student population by gender at The University of Montana-Western since 2012.
| Year | Total | Men | Women |
|---|---|---|---|
| 2012-13 | 1,483 | 632 | 851 |
| 2013-14 | 1,455 -28 | 609 -23 | 846 -5 |
| 2014-15 | 1,375 -80 | 597 -12 | 778 -68 |
| 2015-16 | 1,403 28 | 577 -20 | 826 48 |
| 2016-17 | 1,505 102 | 584 7 | 921 95 |
| 2017-18 | 1,538 33 | 564 -20 | 974 53 |
| 2018-19 | 1,508 -30 | 536 -28 | 972 -2 |
| 2019-20 | 1,358 -150 | 498 -38 | 860 -112 |
| 2020-21 | 1,334 -24 | 464 -34 | 870 10 |
| 2021-22 | 1,399 65 | 461 -3 | 938 68 |
| 2022-23 | 1,424 25 | 452 -9 | 972 34 |
| Average | 1,435 | 543 | 892 |