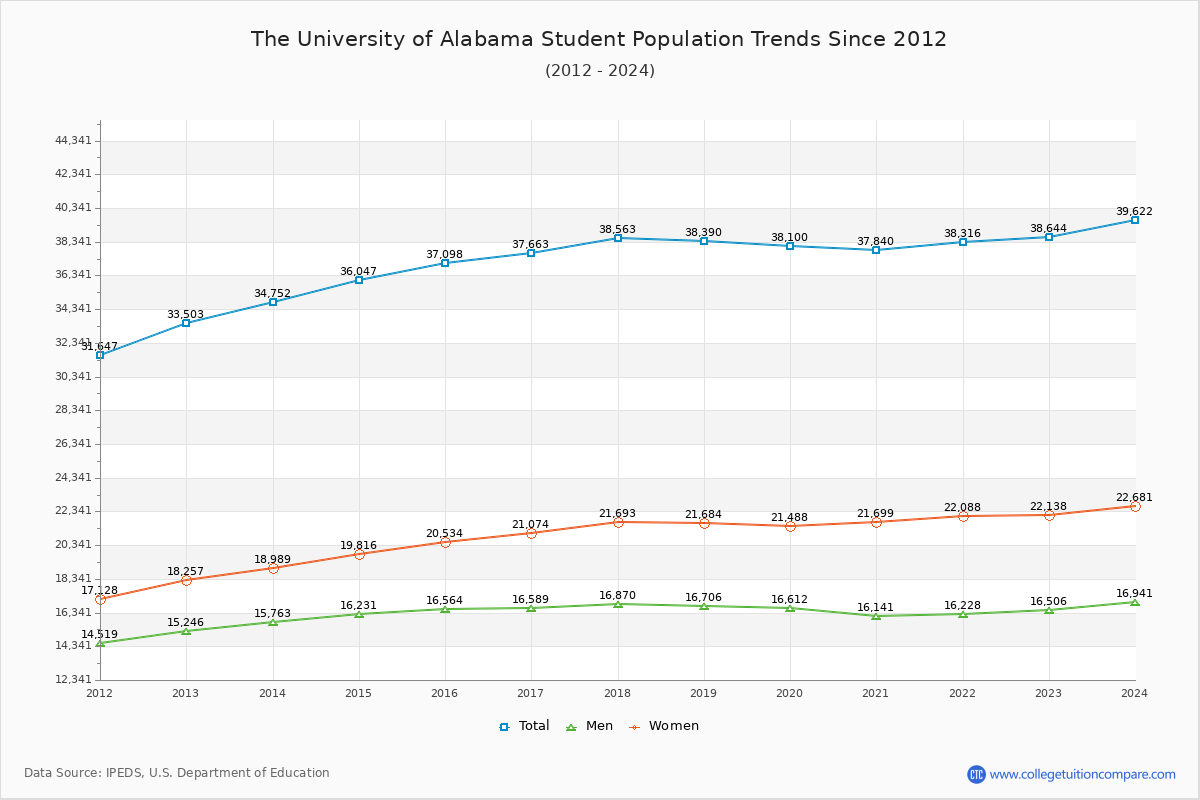
Student Population Changes
The average student population over the last 12 years is 37,174 where 38,644 students are attending the school for the academic year 2022-2023.
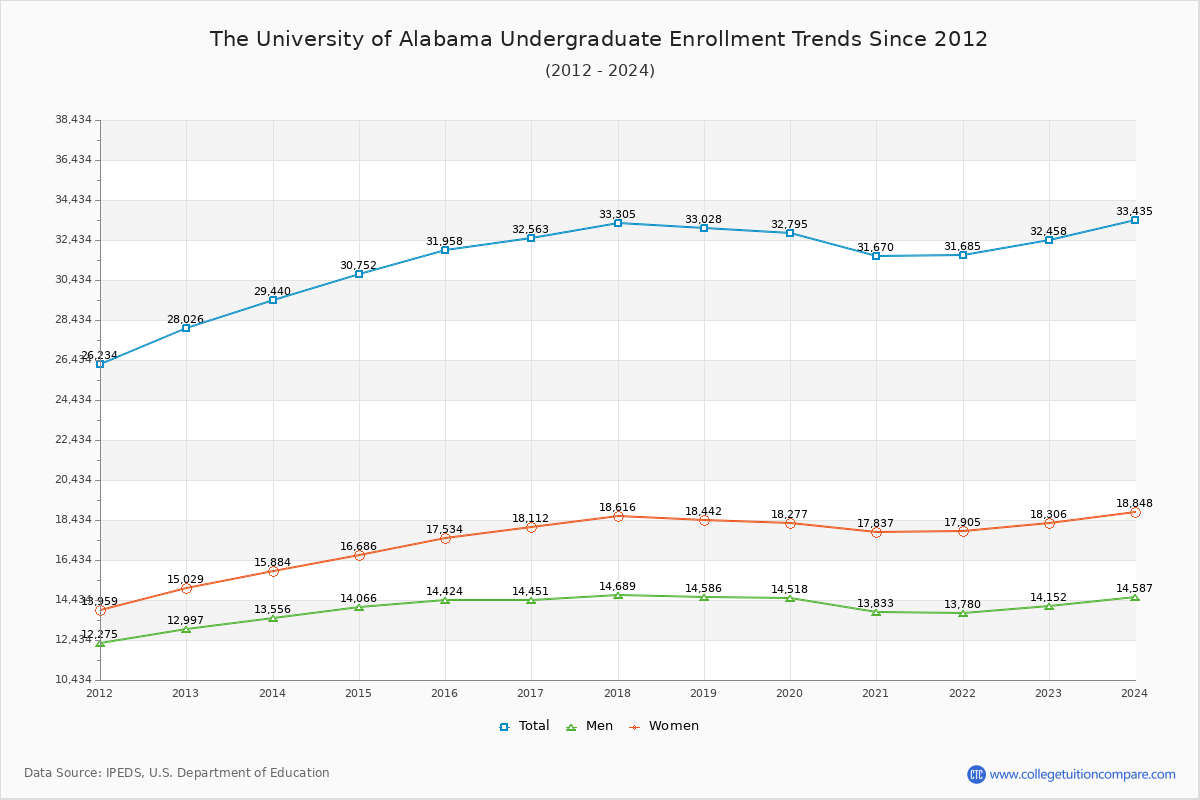
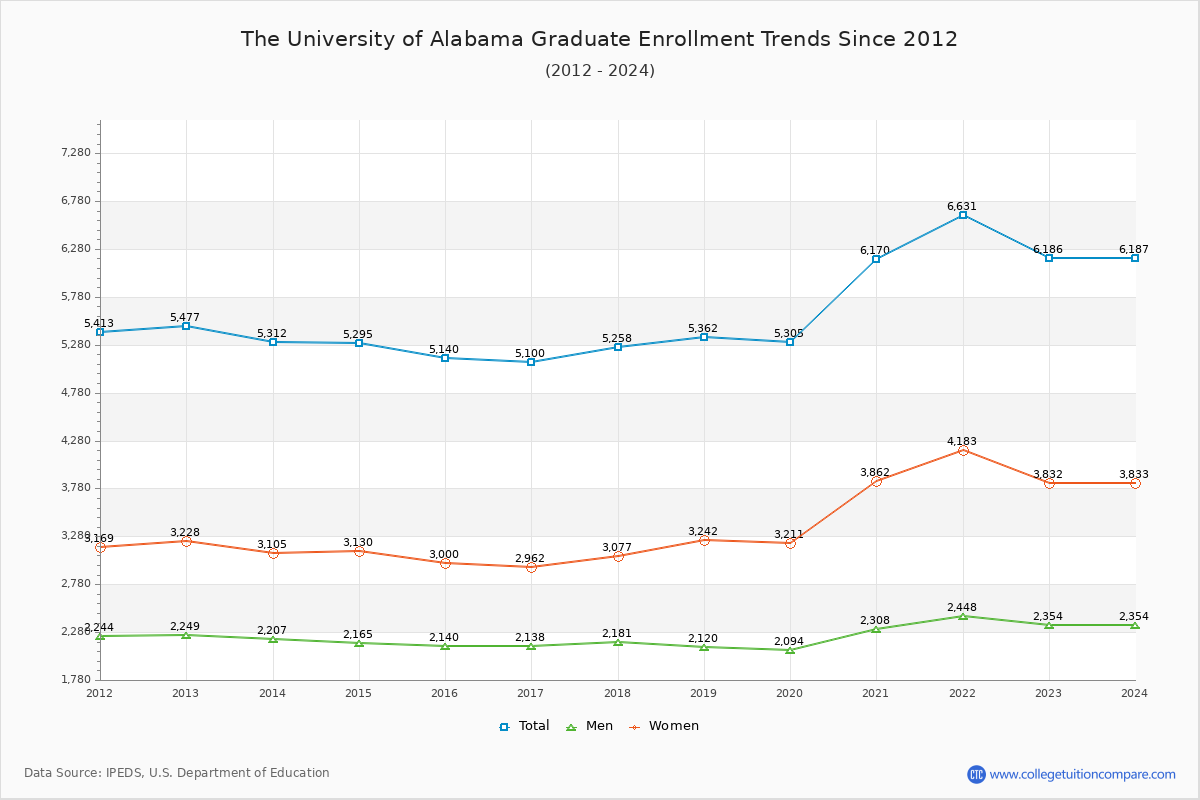
83.99% of total students is undergraduate students and 16.01% students is graduate students. The number of undergraduate students has increased by 4,432 and the graduate enrollment has increased by 709 over past 10 years.
The female to male ratio is 1.34 to 1 and it means that there are more female students enrolled in The University of Alabama than male students.
The following table and chart illustrate the changes in student population by gender at The University of Alabama since 2012.
| Year | Total | Undergraduate | Graduate | ||||
|---|---|---|---|---|---|---|---|
| Total | Men | Women | Total | Men | Women | ||
| 2012-13 | 33,503 | 28,026 | 12,997 | 15,029 | 5,477 | 2,249 | 3,228 |
| 2013-14 | 34,752 1,249 | 29,440 1,414 | 13,556 559 | 15,884 855 | 5,312 -165 | 2,207 -42 | 3,105 -123 |
| 2014-15 | 36,047 1,295 | 30,752 1,312 | 14,066 510 | 16,686 802 | 5,295 -17 | 2,165 -42 | 3,130 25 |
| 2015-16 | 37,098 1,051 | 31,958 1,206 | 14,424 358 | 17,534 848 | 5,140 -155 | 2,140 -25 | 3,000 -130 |
| 2016-17 | 37,663 565 | 32,563 605 | 14,451 27 | 18,112 578 | 5,100 -40 | 2,138 -2 | 2,962 -38 |
| 2017-18 | 38,563 900 | 33,305 742 | 14,689 238 | 18,616 504 | 5,258 158 | 2,181 43 | 3,077 115 |
| 2018-19 | 38,390 -173 | 33,028 -277 | 14,586 -103 | 18,442 -174 | 5,362 104 | 2,120 -61 | 3,242 165 |
| 2019-20 | 38,100 -290 | 32,795 -233 | 14,518 -68 | 18,277 -165 | 5,305 -57 | 2,094 -26 | 3,211 -31 |
| 2020-21 | 37,840 -260 | 31,670 -1,125 | 13,833 -685 | 17,837 -440 | 6,170 865 | 2,308 214 | 3,862 651 |
| 2021-22 | 38,316 476 | 31,685 15 | 13,780 -53 | 17,905 68 | 6,631 461 | 2,448 140 | 4,183 321 |
| 2022-23 | 38,644 328 | 32,458 773 | 14,152 372 | 18,306 401 | 6,186 -445 | 2,354 -94 | 3,832 -351 |
| Average | 37,174 | 31,607 | 14,096 | 17,512 | 5,567 | 2,219 | 3,348 |