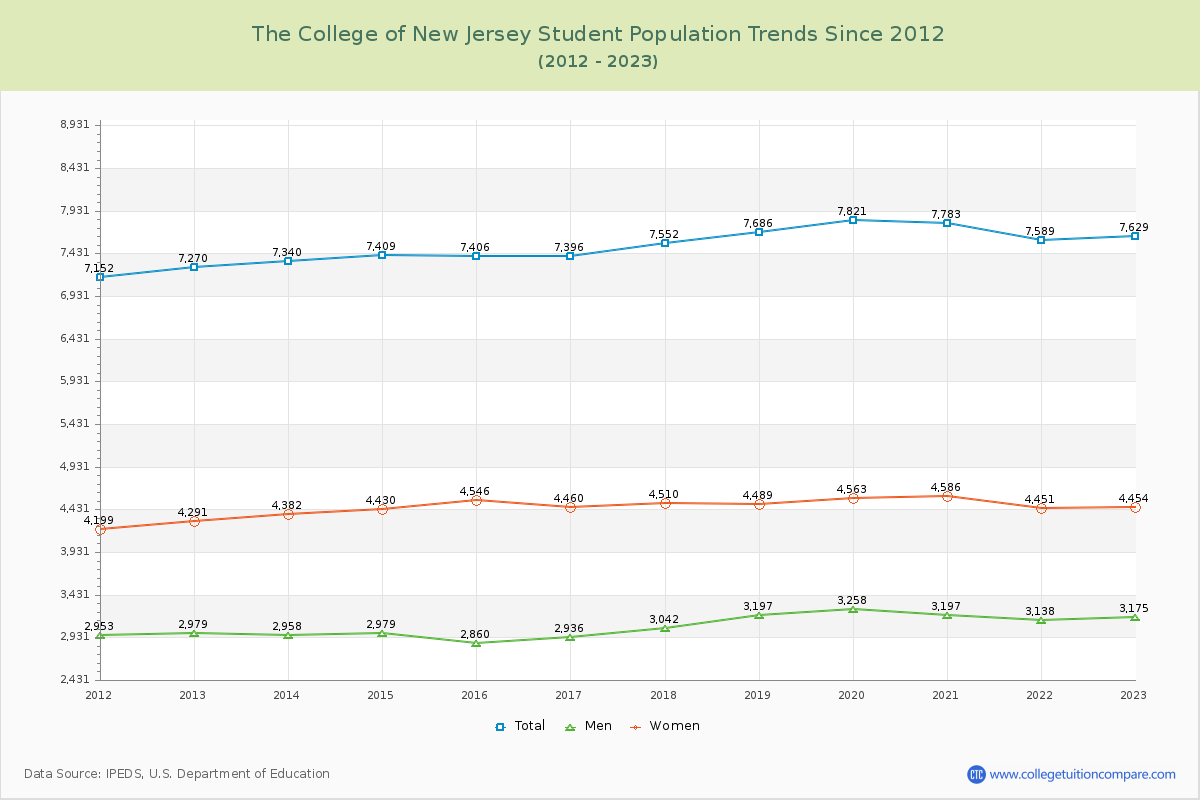
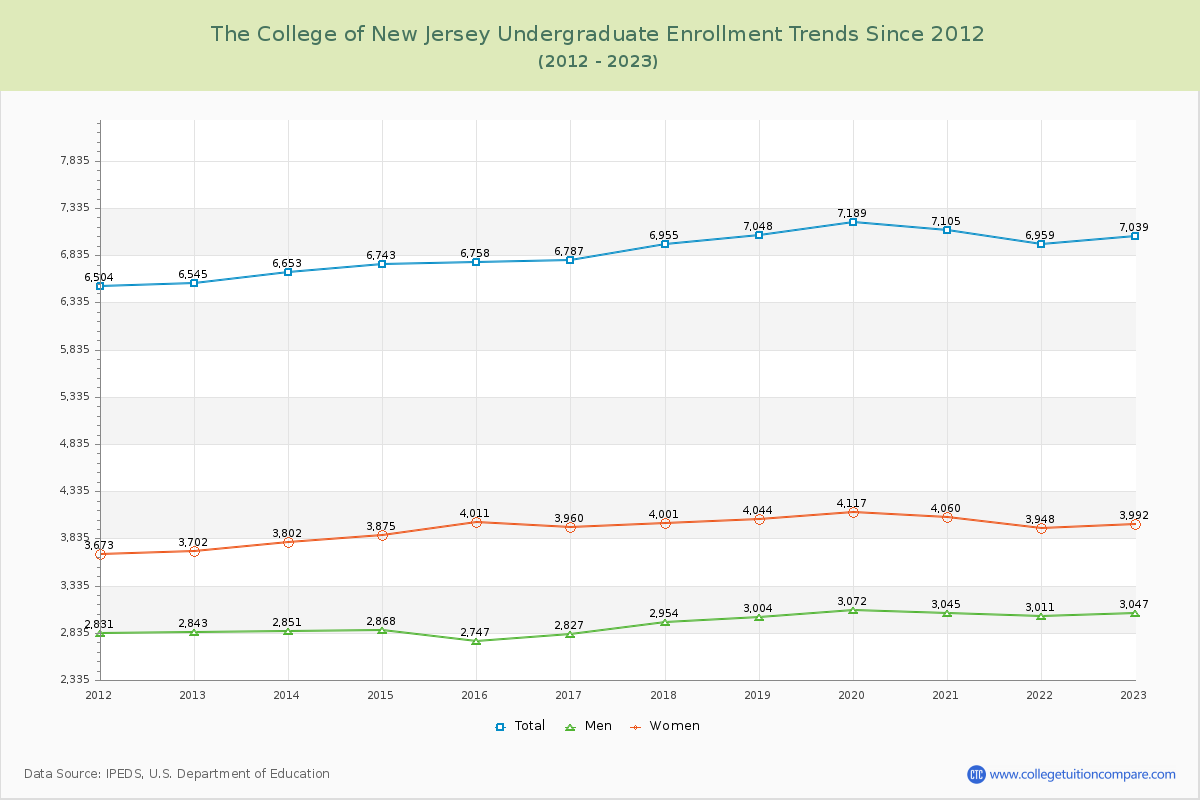
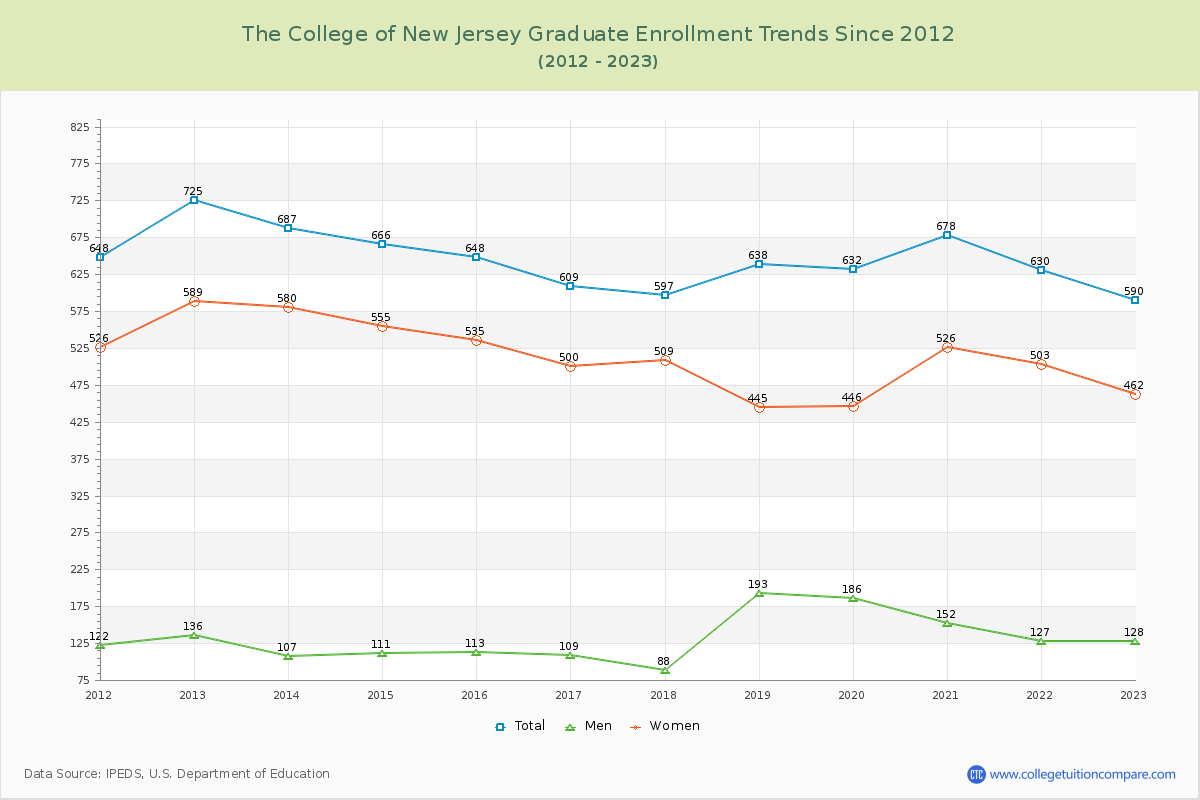
Student Population Changes
The average student population over the last 12 years is 7,535 where 7,629 students are attending the school for the academic year 2022-2023.
92.27% of total students is undergraduate students and 7.73% students is graduate students. The number of undergraduate students has increased by 494 and the graduate enrollment has decreased by 135 over past 10 years.
The female to male ratio is 1.40 to 1 and it means that there are more female students enrolled in TCNJ than male students.
The following table and chart illustrate the changes in student population by gender at The College of New Jersey since 2012.
| Year | Total | Undergraduate | Graduate | ||||
|---|---|---|---|---|---|---|---|
| Total | Men | Women | Total | Men | Women | ||
| 2012-13 | 7,270 | 6,545 | 2,843 | 3,702 | 725 | 136 | 589 |
| 2013-14 | 7,340 70 | 6,653 108 | 2,851 8 | 3,802 100 | 687 -38 | 107 -29 | 580 -9 |
| 2014-15 | 7,409 69 | 6,743 90 | 2,868 17 | 3,875 73 | 666 -21 | 111 4 | 555 -25 |
| 2015-16 | 7,406 -3 | 6,758 15 | 2,747 -121 | 4,011 136 | 648 -18 | 113 2 | 535 -20 |
| 2016-17 | 7,396 -10 | 6,787 29 | 2,827 80 | 3,960 -51 | 609 -39 | 109 -4 | 500 -35 |
| 2017-18 | 7,552 156 | 6,955 168 | 2,954 127 | 4,001 41 | 597 -12 | 88 -21 | 509 9 |
| 2018-19 | 7,686 134 | 7,048 93 | 3,004 50 | 4,044 43 | 638 41 | 193 105 | 445 -64 |
| 2019-20 | 7,821 135 | 7,189 141 | 3,072 68 | 4,117 73 | 632 -6 | 186 -7 | 446 1 |
| 2020-21 | 7,783 -38 | 7,105 -84 | 3,045 -27 | 4,060 -57 | 678 46 | 152 -34 | 526 80 |
| 2021-22 | 7,589 -194 | 6,959 -146 | 3,011 -34 | 3,948 -112 | 630 -48 | 127 -25 | 503 -23 |
| 2022-23 | 7,629 40 | 7,039 80 | 3,047 36 | 3,992 44 | 590 -40 | 128 1 | 462 -41 |
| Average | 7,535 | 6,889 | 2,934 | 3,956 | 645 | 132 | 514 |