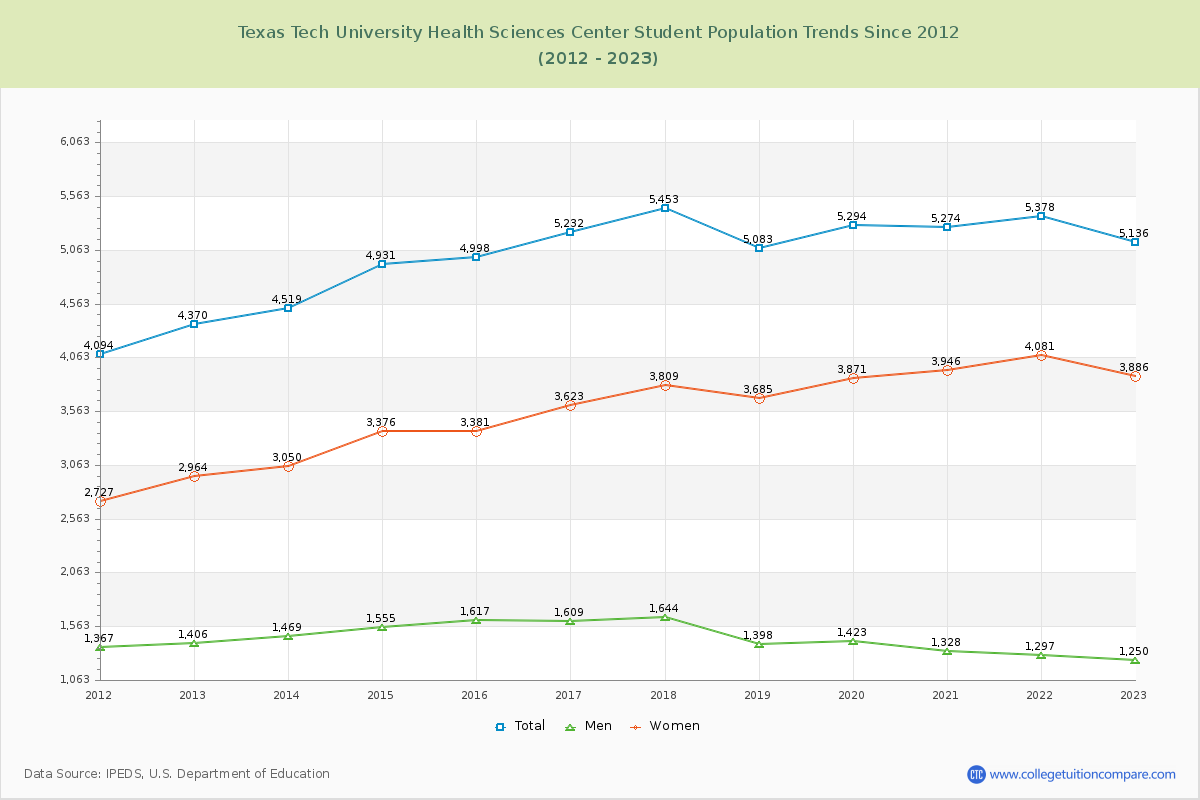
Student Population Changes
The average student population over the last 12 years is 5,061 where 5,136 students are attending the school for the academic year 2022-2023.
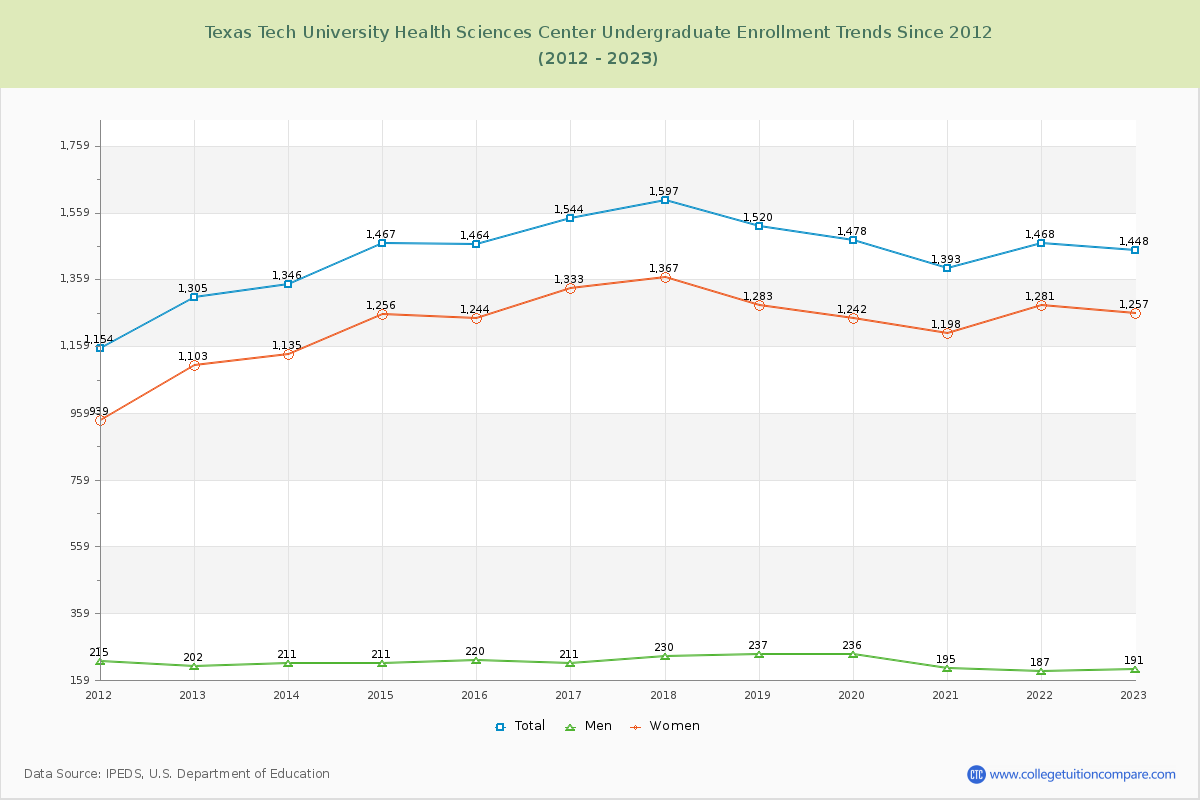
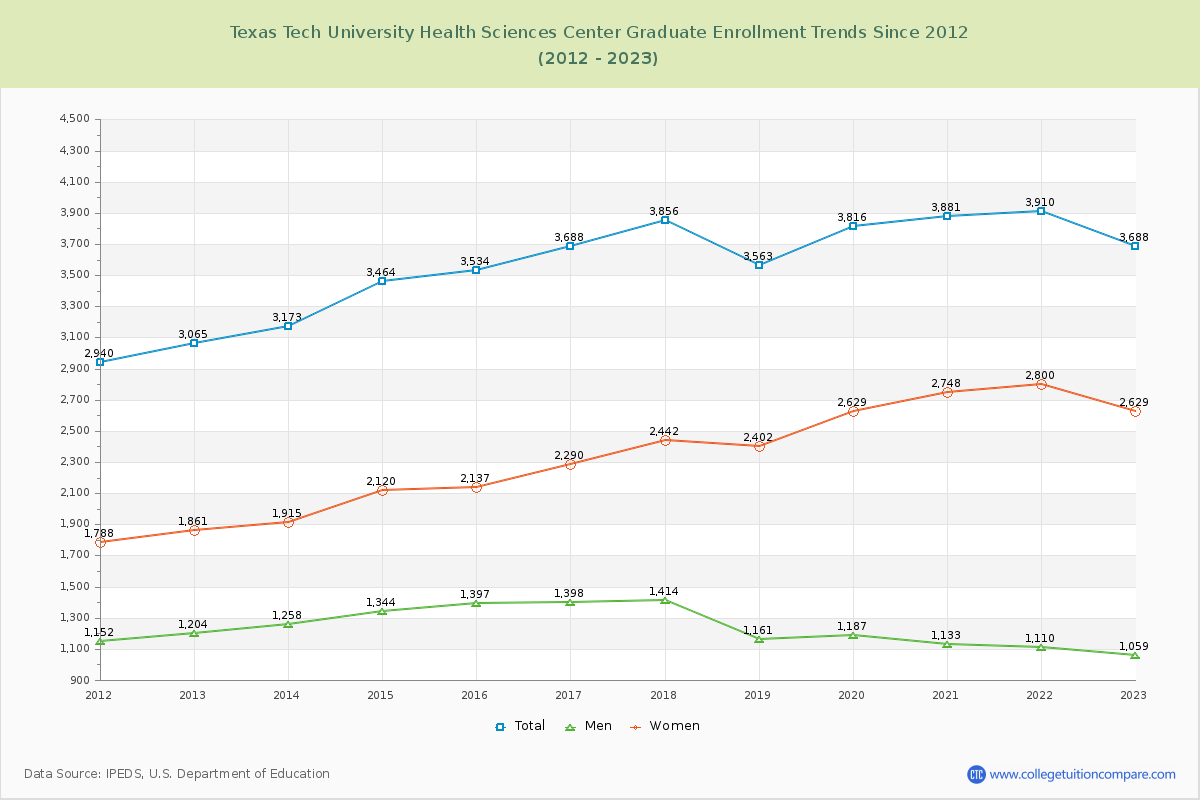
28.19% of total students is undergraduate students and 71.81% students is graduate students. The number of undergraduate students has increased by 143 and the graduate enrollment has increased by 623 over past 10 years.
The female to male ratio is 3.11 to 1 and it means that there are far more female students enrolled in Texas Tech University Health Sciences Center than male students.
The following table and chart illustrate the changes in student population by gender at Texas Tech University Health Sciences Center since 2012.
| Year | Total | Undergraduate | Graduate | ||||
|---|---|---|---|---|---|---|---|
| Total | Men | Women | Total | Men | Women | ||
| 2012-13 | 4,370 | 1,305 | 202 | 1,103 | 3,065 | 1,204 | 1,861 |
| 2013-14 | 4,519 149 | 1,346 41 | 211 9 | 1,135 32 | 3,173 108 | 1,258 54 | 1,915 54 |
| 2014-15 | 4,931 412 | 1,467 121 | 211 0 | 1,256 121 | 3,464 291 | 1,344 86 | 2,120 205 |
| 2015-16 | 4,998 67 | 1,464 -3 | 220 9 | 1,244 -12 | 3,534 70 | 1,397 53 | 2,137 17 |
| 2016-17 | 5,232 234 | 1,544 80 | 211 -9 | 1,333 89 | 3,688 154 | 1,398 1 | 2,290 153 |
| 2017-18 | 5,453 221 | 1,597 53 | 230 19 | 1,367 34 | 3,856 168 | 1,414 16 | 2,442 152 |
| 2018-19 | 5,083 -370 | 1,520 -77 | 237 7 | 1,283 -84 | 3,563 -293 | 1,161 -253 | 2,402 -40 |
| 2019-20 | 5,294 211 | 1,478 -42 | 236 -1 | 1,242 -41 | 3,816 253 | 1,187 26 | 2,629 227 |
| 2020-21 | 5,274 -20 | 1,393 -85 | 195 -41 | 1,198 -44 | 3,881 65 | 1,133 -54 | 2,748 119 |
| 2021-22 | 5,378 104 | 1,468 75 | 187 -8 | 1,281 83 | 3,910 29 | 1,110 -23 | 2,800 52 |
| 2022-23 | 5,136 -242 | 1,448 -20 | 191 4 | 1,257 -24 | 3,688 -222 | 1,059 -51 | 2,629 -171 |
| Average | 5,061 | 1,457 | 212 | 1,245 | 3,603 | 1,242 | 2,361 |