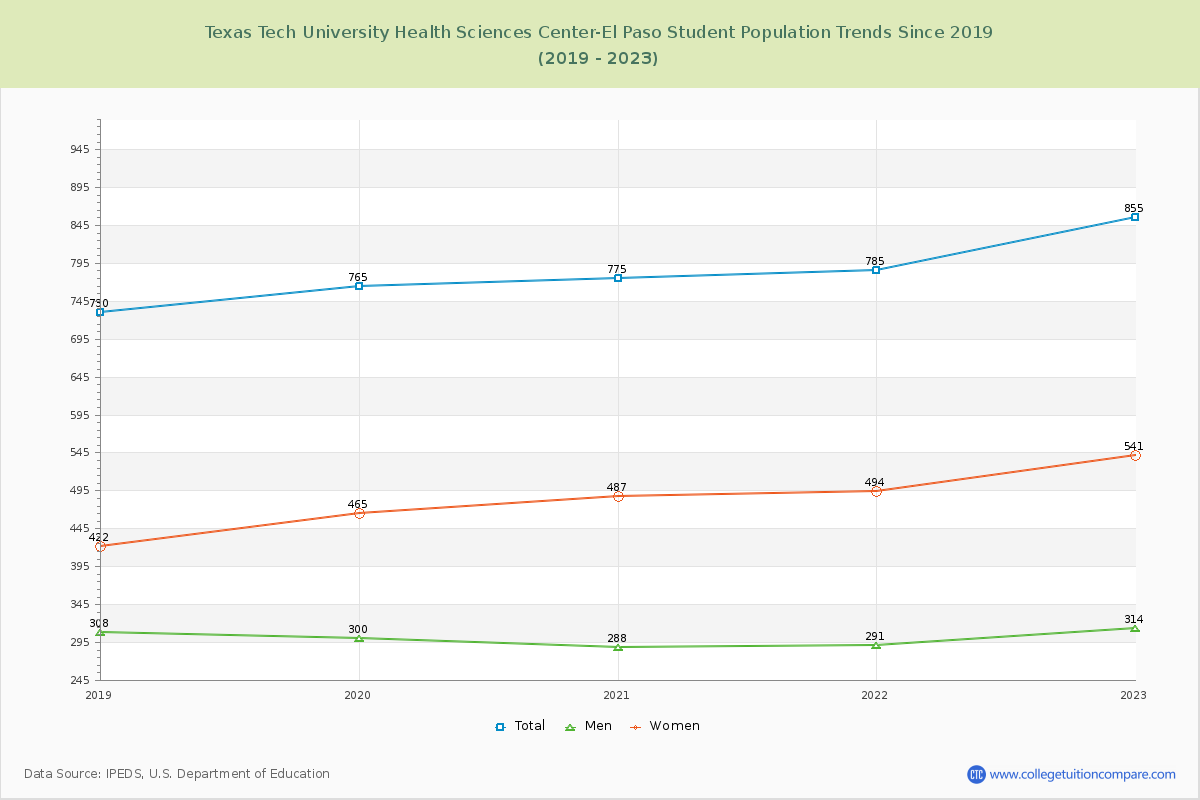
Student Population Changes
The average student population over the last 6 years is 782 where 855 students are attending the school for the academic year 2022-2023.
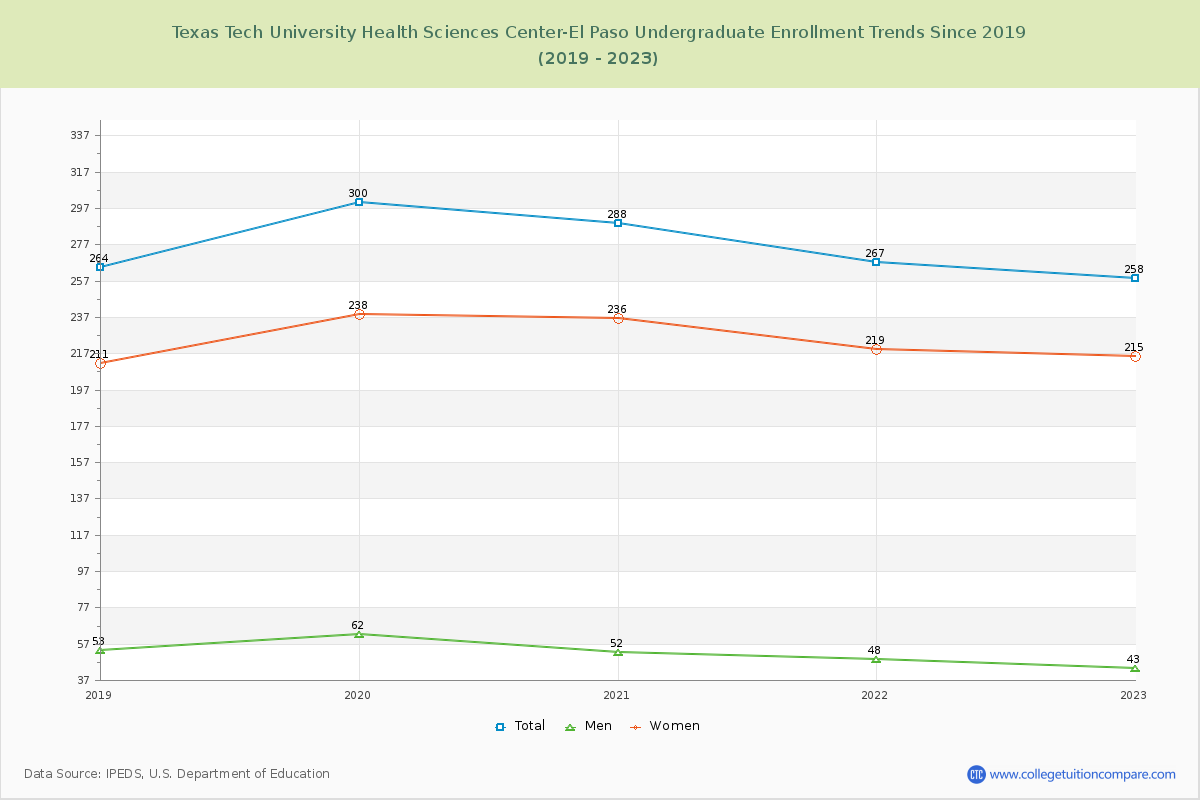
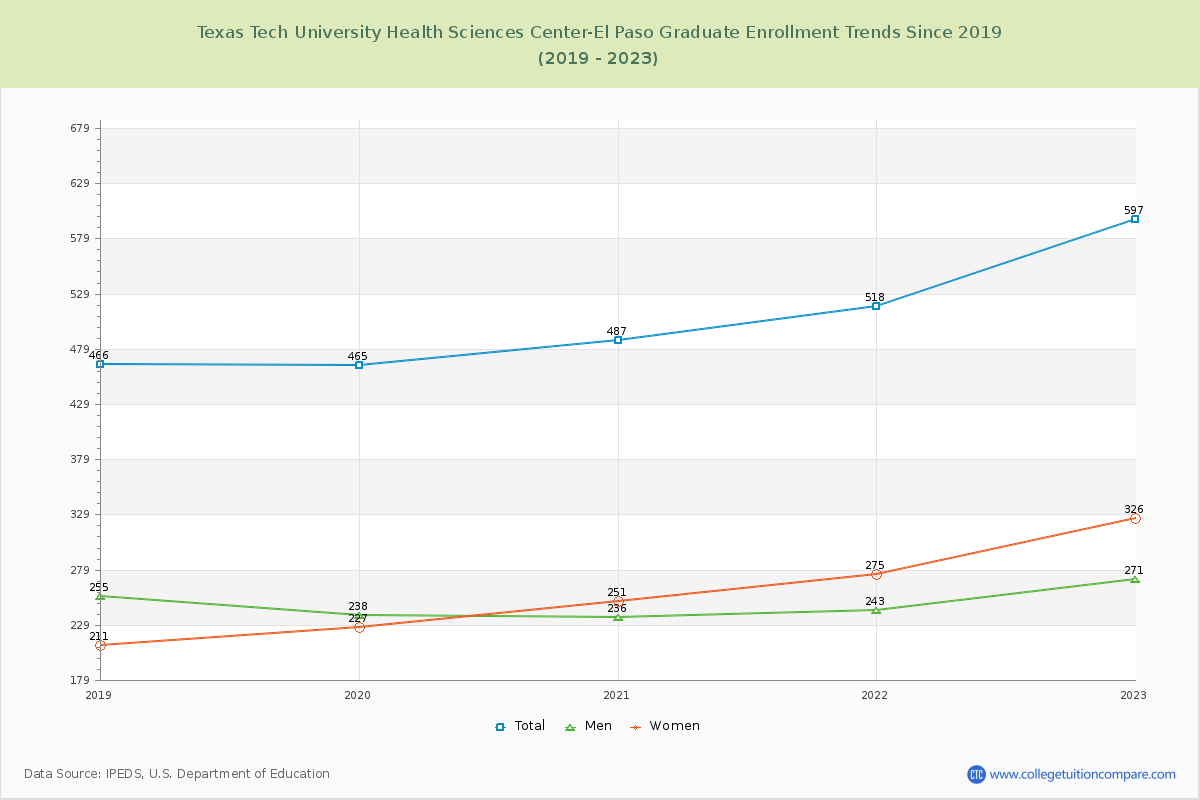
30.18% of total students is undergraduate students and 69.82% students is graduate students. The number of undergraduate students has decreased by 6 and the graduate enrollment has increased by 131 over past 10 years.
The female to male ratio is 1.72 to 1 and it means that there are more female students enrolled in Texas Tech University Health Sciences Center-El Paso than male students.
The following table and chart illustrate the changes in student population by gender at Texas Tech University Health Sciences Center-El Paso since 2018.
| Year | Total | Undergraduate | Graduate | ||||
|---|---|---|---|---|---|---|---|
| Total | Men | Women | Total | Men | Women | ||
| 2018-19 | 730 | 264 | 53 | 211 | 466 | 255 | 211 |
| 2019-20 | 765 35 | 300 36 | 62 9 | 238 27 | 465 -1 | 238 -17 | 227 16 |
| 2020-21 | 775 10 | 288 -12 | 52 -10 | 236 -2 | 487 22 | 236 -2 | 251 24 |
| 2021-22 | 785 10 | 267 -21 | 48 -4 | 219 -17 | 518 31 | 243 7 | 275 24 |
| 2022-23 | 855 70 | 258 -9 | 43 -5 | 215 -4 | 597 79 | 271 28 | 326 51 |
| Average | 782 | 275 | 52 | 224 | 507 | 249 | 258 |