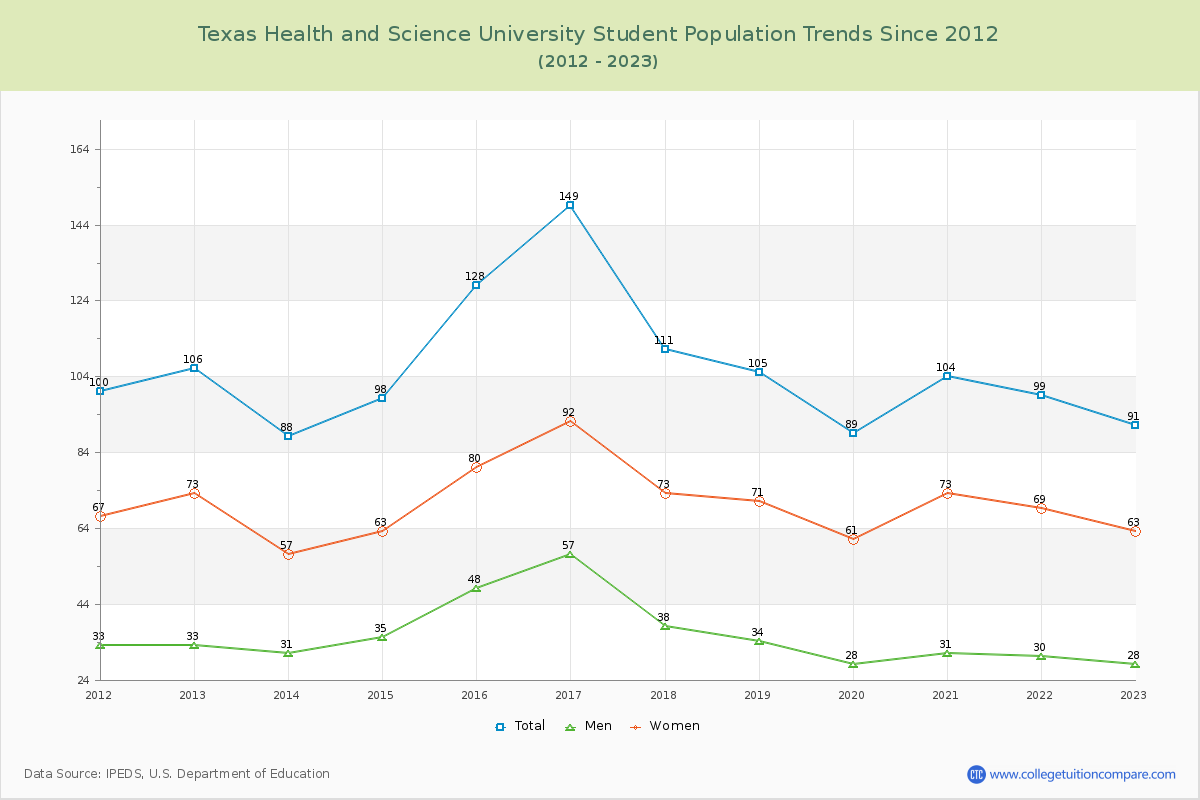
Student Population Changes
The average student population over the last 12 years is 106 where 91 students are attending the school for the academic year 2022-2023.
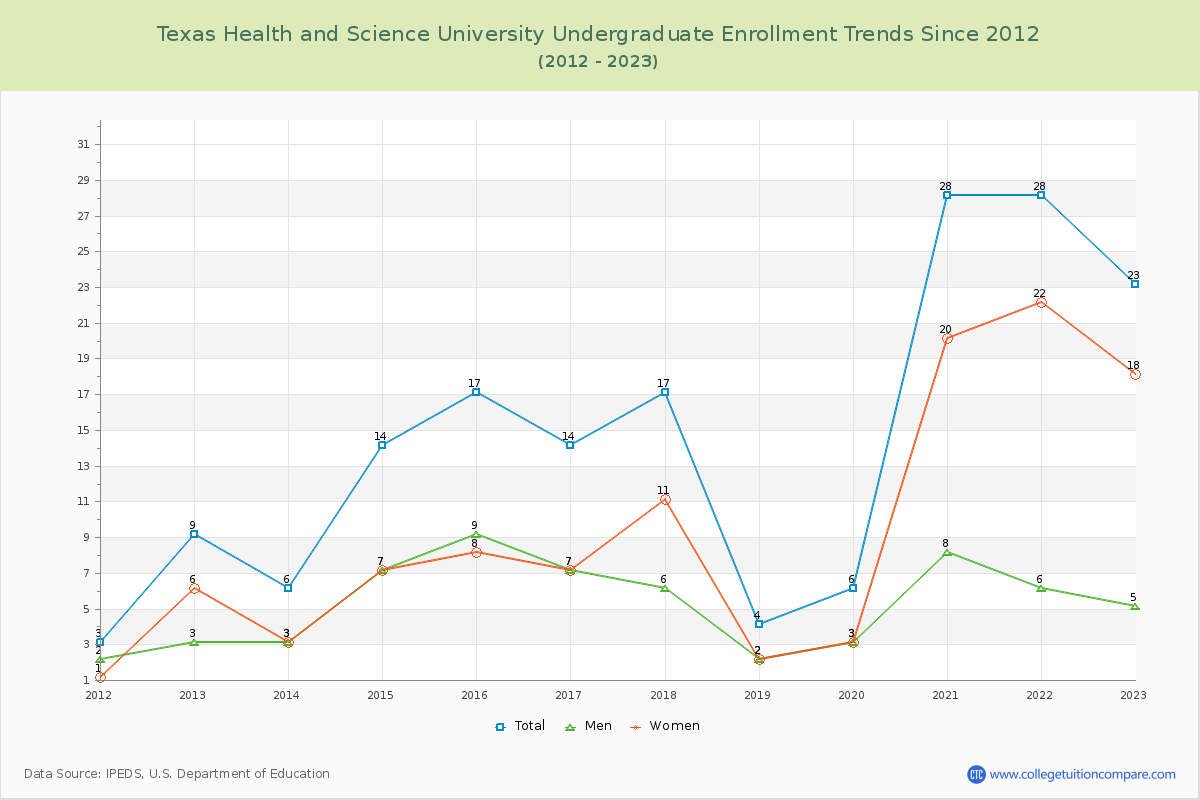
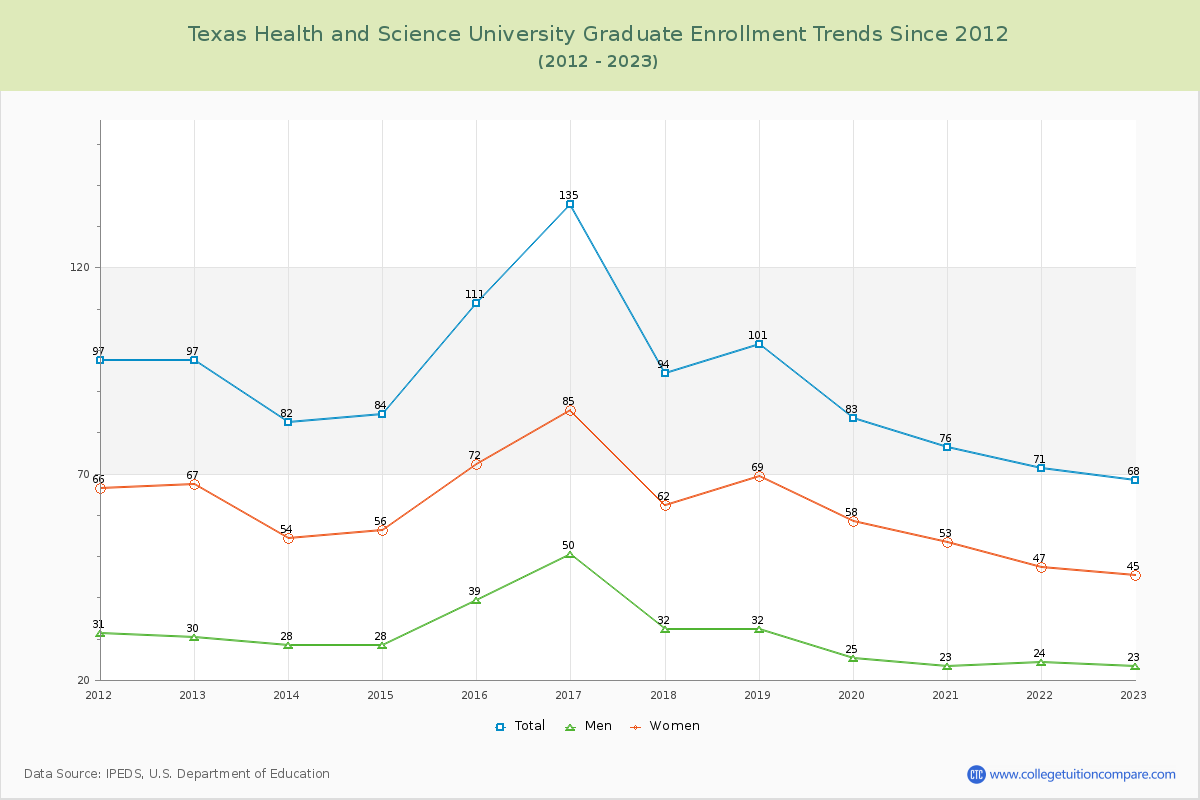
25.27% of total students is undergraduate students and 74.73% students is graduate students. The number of undergraduate students has increased by 14 and the graduate enrollment has decreased by 29 over past 10 years.
The female to male ratio is 2.25 to 1 and it means that there are far more female students enrolled in THSU than male students.
The following table and chart illustrate the changes in student population by gender at Texas Health and Science University since 2012.
| Year | Total | Undergraduate | Graduate | ||||
|---|---|---|---|---|---|---|---|
| Total | Men | Women | Total | Men | Women | ||
| 2012-13 | 106 | 9 | 3 | 6 | 97 | 30 | 67 |
| 2013-14 | 88 -18 | 6 -3 | 3 0 | 3 -3 | 82 -15 | 28 -2 | 54 -13 |
| 2014-15 | 98 10 | 14 8 | 7 4 | 7 4 | 84 2 | 28 0 | 56 2 |
| 2015-16 | 128 30 | 17 3 | 9 2 | 8 1 | 111 27 | 39 11 | 72 16 |
| 2016-17 | 149 21 | 14 -3 | 7 -2 | 7 -1 | 135 24 | 50 11 | 85 13 |
| 2017-18 | 111 -38 | 17 3 | 6 -1 | 11 4 | 94 -41 | 32 -18 | 62 -23 |
| 2018-19 | 105 -6 | 4 -13 | 2 -4 | 2 -9 | 101 7 | 32 0 | 69 7 |
| 2019-20 | 89 -16 | 6 2 | 3 1 | 3 1 | 83 -18 | 25 -7 | 58 -11 |
| 2020-21 | 104 15 | 28 22 | 8 5 | 20 17 | 76 -7 | 23 -2 | 53 -5 |
| 2021-22 | 99 -5 | 28 0 | 6 -2 | 22 2 | 71 -5 | 24 1 | 47 -6 |
| 2022-23 | 91 -8 | 23 -5 | 5 -1 | 18 -4 | 68 -3 | 23 -1 | 45 -2 |
| Average | 106 | 15 | 5 | 10 | 91 | 30 | 61 |