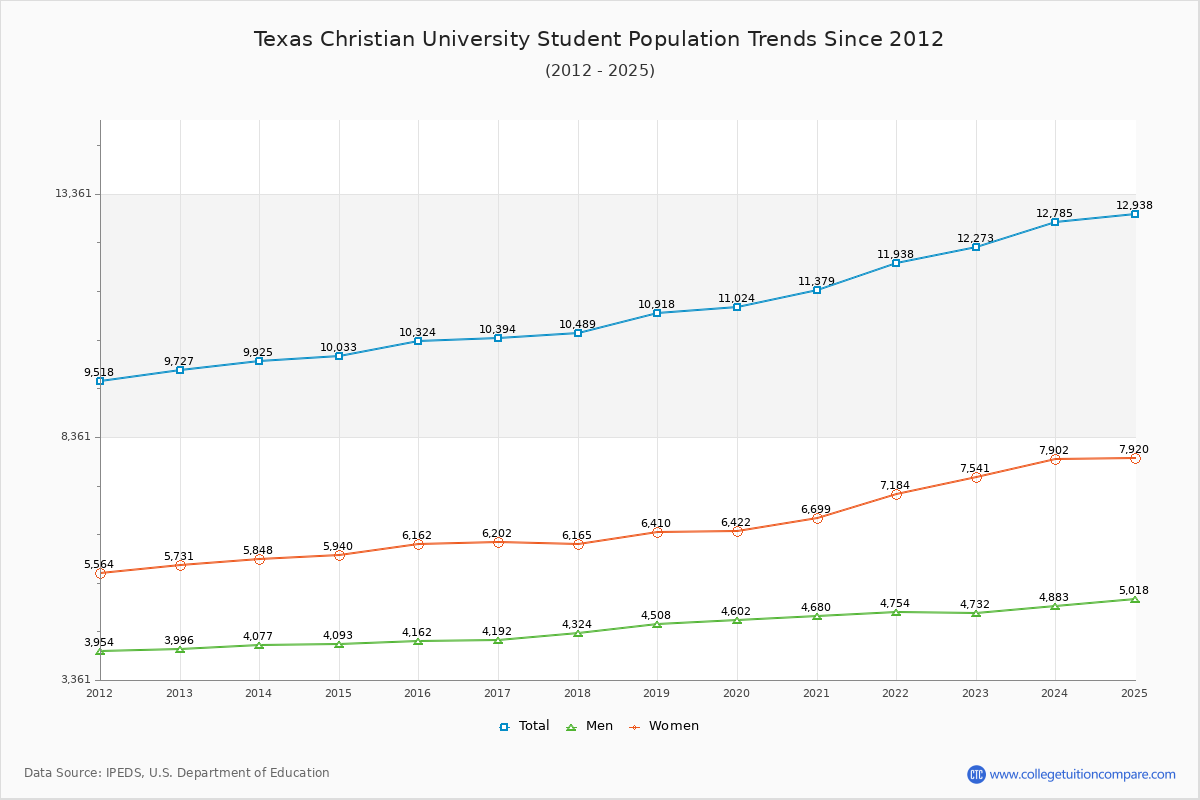
Student Population Changes
The average student population over the last 12 years is 10,766 where 12,273 students are attending the school for the academic year 2022-2023.
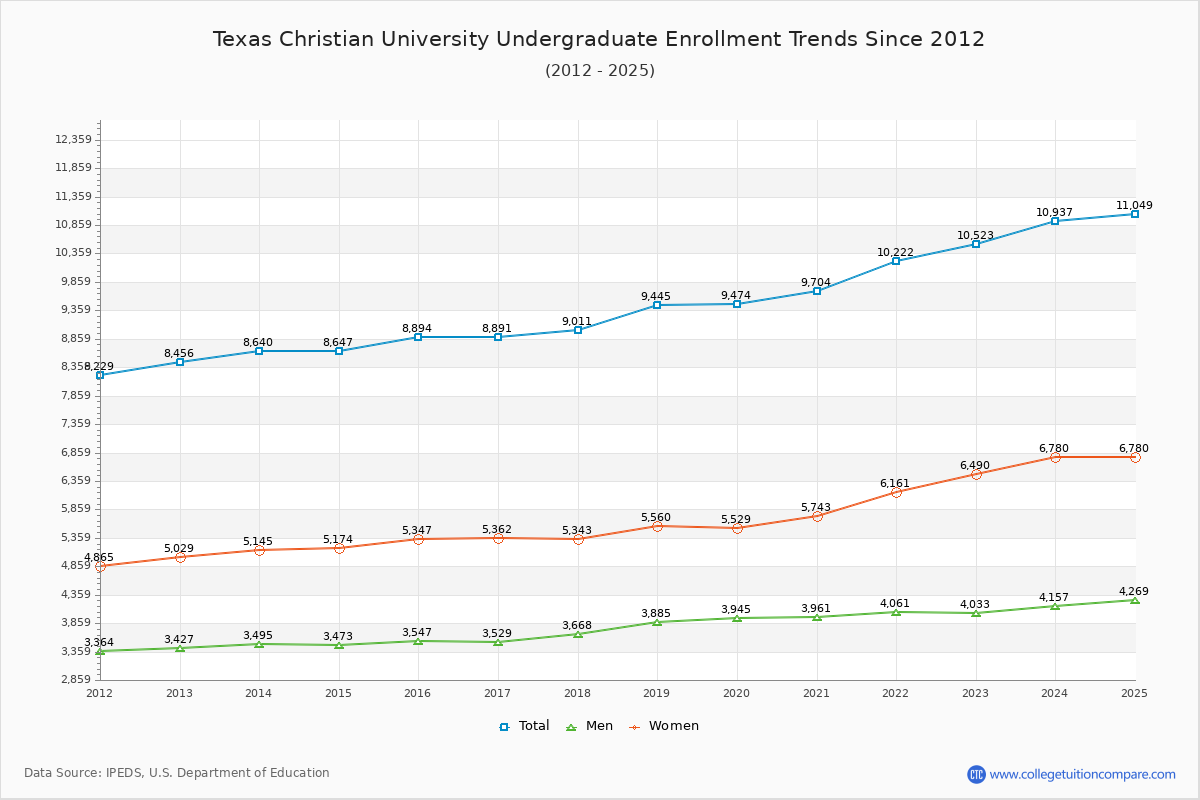
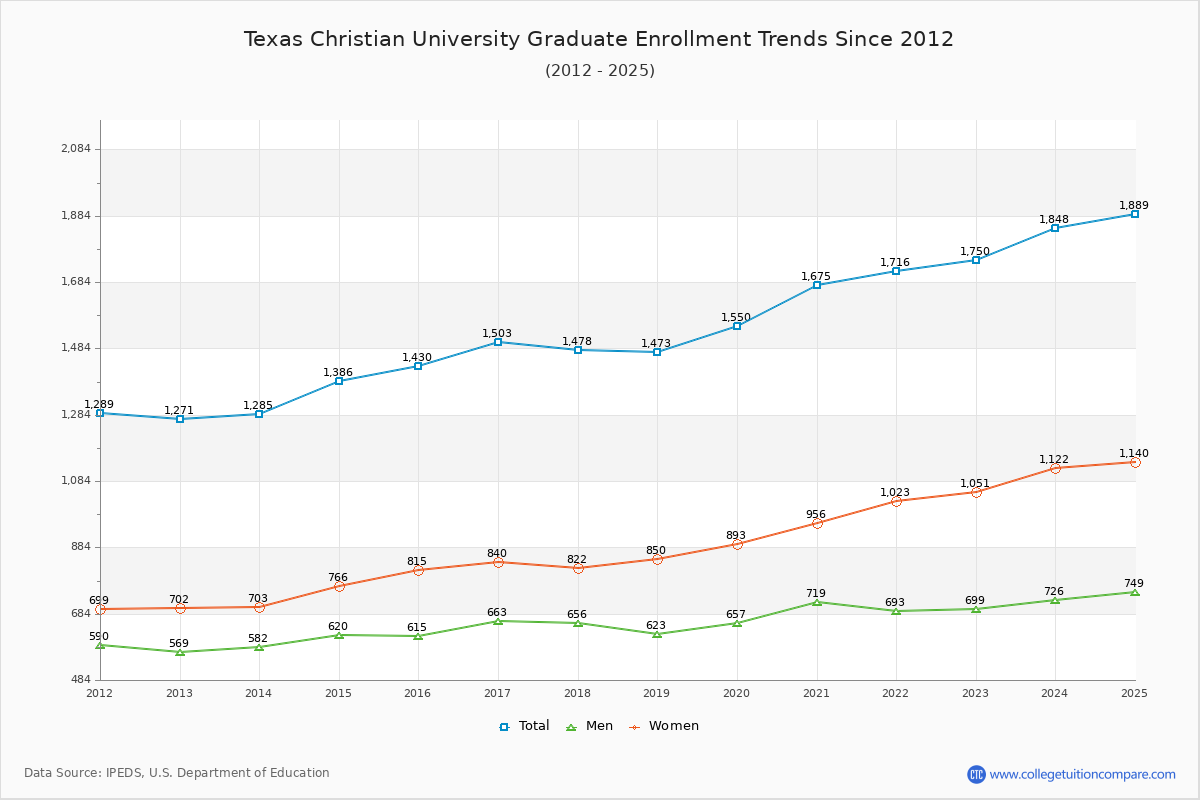
85.74% of total students is undergraduate students and 14.26% students is graduate students. The number of undergraduate students has increased by 2,067 and the graduate enrollment has increased by 479 over past 10 years.
The female to male ratio is 1.59 to 1 and it means that there are more female students enrolled in TCU than male students.
The following table and chart illustrate the changes in student population by gender at Texas Christian University since 2012.
| Year | Total | Undergraduate | Graduate | ||||
|---|---|---|---|---|---|---|---|
| Total | Men | Women | Total | Men | Women | ||
| 2012-13 | 9,727 | 8,456 | 3,427 | 5,029 | 1,271 | 569 | 702 |
| 2013-14 | 9,925 198 | 8,640 184 | 3,495 68 | 5,145 116 | 1,285 14 | 582 13 | 703 1 |
| 2014-15 | 10,033 108 | 8,647 7 | 3,473 -22 | 5,174 29 | 1,386 101 | 620 38 | 766 63 |
| 2015-16 | 10,324 291 | 8,894 247 | 3,547 74 | 5,347 173 | 1,430 44 | 615 -5 | 815 49 |
| 2016-17 | 10,394 70 | 8,891 -3 | 3,529 -18 | 5,362 15 | 1,503 73 | 663 48 | 840 25 |
| 2017-18 | 10,489 95 | 9,011 120 | 3,668 139 | 5,343 -19 | 1,478 -25 | 656 -7 | 822 -18 |
| 2018-19 | 10,918 429 | 9,445 434 | 3,885 217 | 5,560 217 | 1,473 -5 | 623 -33 | 850 28 |
| 2019-20 | 11,024 106 | 9,474 29 | 3,945 60 | 5,529 -31 | 1,550 77 | 657 34 | 893 43 |
| 2020-21 | 11,379 355 | 9,704 230 | 3,961 16 | 5,743 214 | 1,675 125 | 719 62 | 956 63 |
| 2021-22 | 11,938 559 | 10,222 518 | 4,061 100 | 6,161 418 | 1,716 41 | 693 -26 | 1,023 67 |
| 2022-23 | 12,273 335 | 10,523 301 | 4,033 -28 | 6,490 329 | 1,750 34 | 699 6 | 1,051 28 |
| Average | 10,766 | 9,264 | 3,729 | 5,535 | 1,502 | 645 | 856 |