Student Population Changes
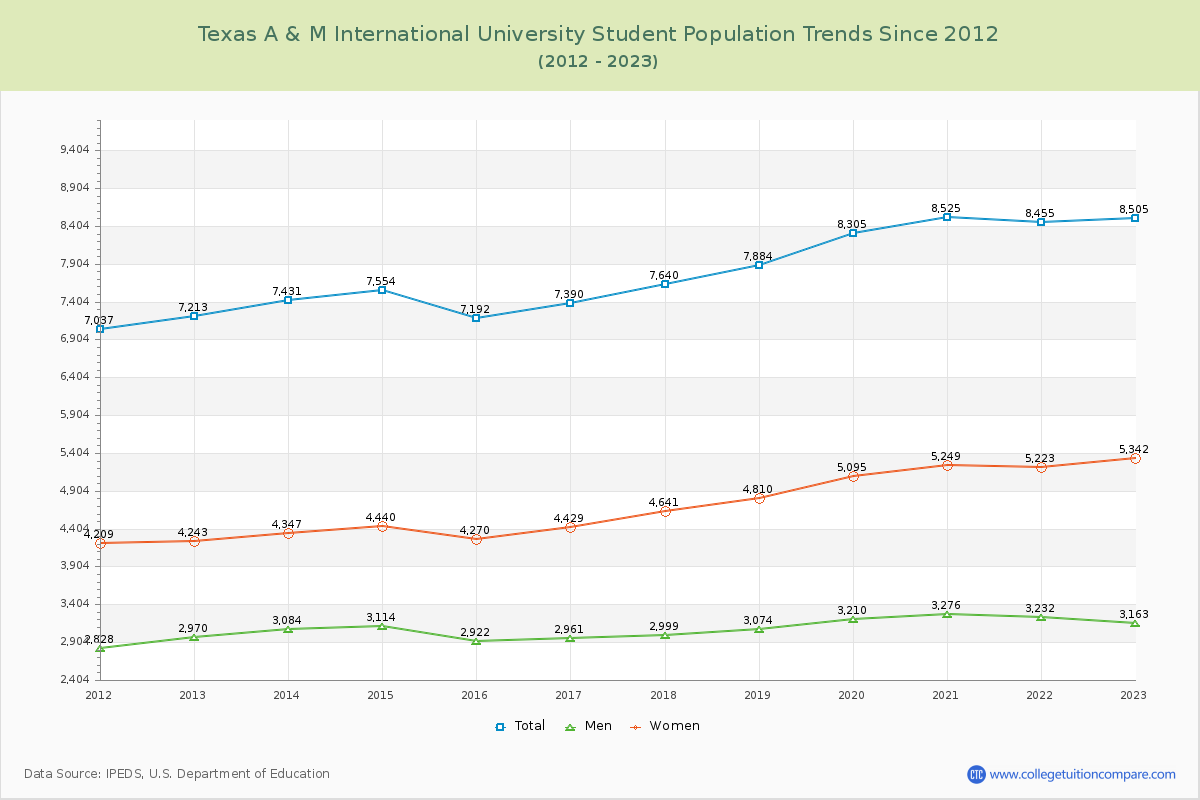
The average student population over the last 12 years is 7,827 where 8,505 students are attending the school for the academic year 2022-2023.
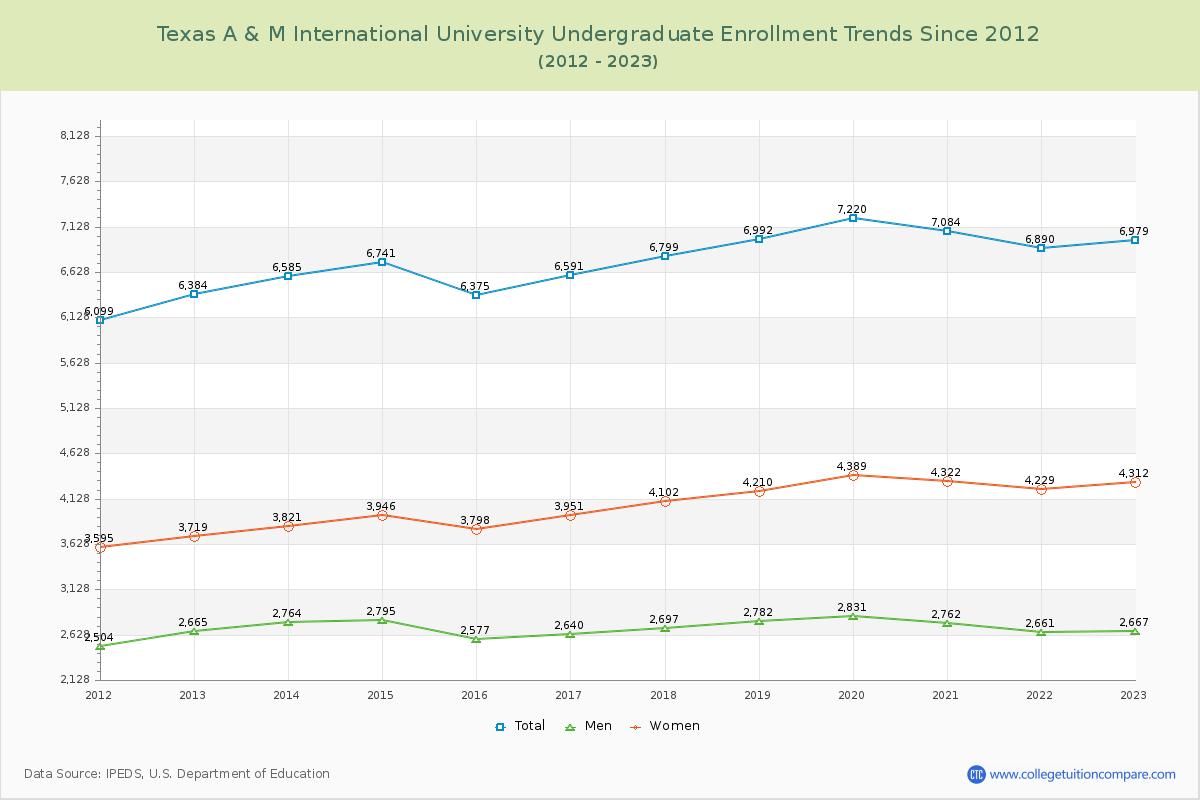
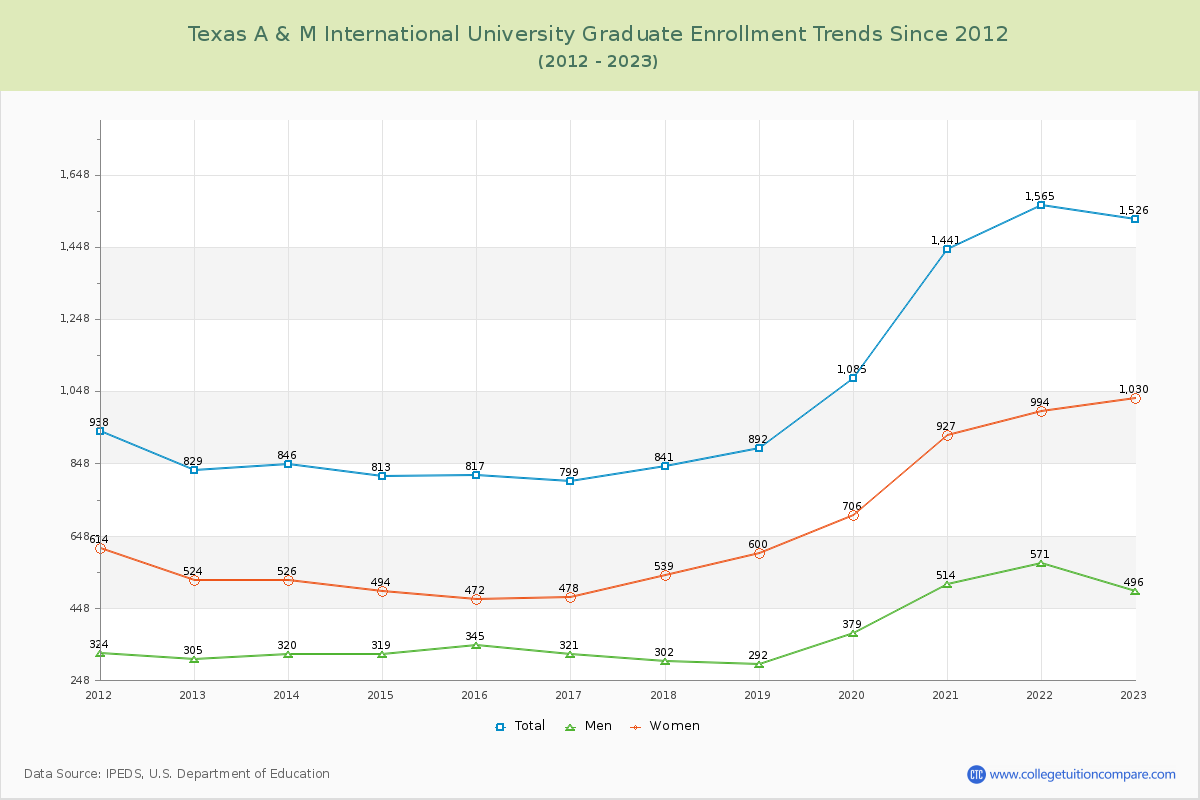
82.06% of total students is undergraduate students and 17.94% students is graduate students. The number of undergraduate students has increased by 595 and the graduate enrollment has increased by 697 over past 10 years.
The female to male ratio is 1.69 to 1 and it means that there are more female students enrolled in Texas A & M International than male students.
The following table and chart illustrate the changes in student population by gender at Texas A & M International University since 2012.
| Year | Total | Undergraduate | Graduate | ||||
|---|---|---|---|---|---|---|---|
| Total | Men | Women | Total | Men | Women | ||
| 2012-13 | 7,213 | 6,384 | 2,665 | 3,719 | 829 | 305 | 524 |
| 2013-14 | 7,431 218 | 6,585 201 | 2,764 99 | 3,821 102 | 846 17 | 320 15 | 526 2 |
| 2014-15 | 7,554 123 | 6,741 156 | 2,795 31 | 3,946 125 | 813 -33 | 319 -1 | 494 -32 |
| 2015-16 | 7,192 -362 | 6,375 -366 | 2,577 -218 | 3,798 -148 | 817 4 | 345 26 | 472 -22 |
| 2016-17 | 7,390 198 | 6,591 216 | 2,640 63 | 3,951 153 | 799 -18 | 321 -24 | 478 6 |
| 2017-18 | 7,640 250 | 6,799 208 | 2,697 57 | 4,102 151 | 841 42 | 302 -19 | 539 61 |
| 2018-19 | 7,884 244 | 6,992 193 | 2,782 85 | 4,210 108 | 892 51 | 292 -10 | 600 61 |
| 2019-20 | 8,305 421 | 7,220 228 | 2,831 49 | 4,389 179 | 1,085 193 | 379 87 | 706 106 |
| 2020-21 | 8,525 220 | 7,084 -136 | 2,762 -69 | 4,322 -67 | 1,441 356 | 514 135 | 927 221 |
| 2021-22 | 8,455 -70 | 6,890 -194 | 2,661 -101 | 4,229 -93 | 1,565 124 | 571 57 | 994 67 |
| 2022-23 | 8,505 50 | 6,979 89 | 2,667 6 | 4,312 83 | 1,526 -39 | 496 -75 | 1,030 36 |
| Average | 7,827 | 6,785 | 2,713 | 4,073 | 1,041 | 379 | 663 |