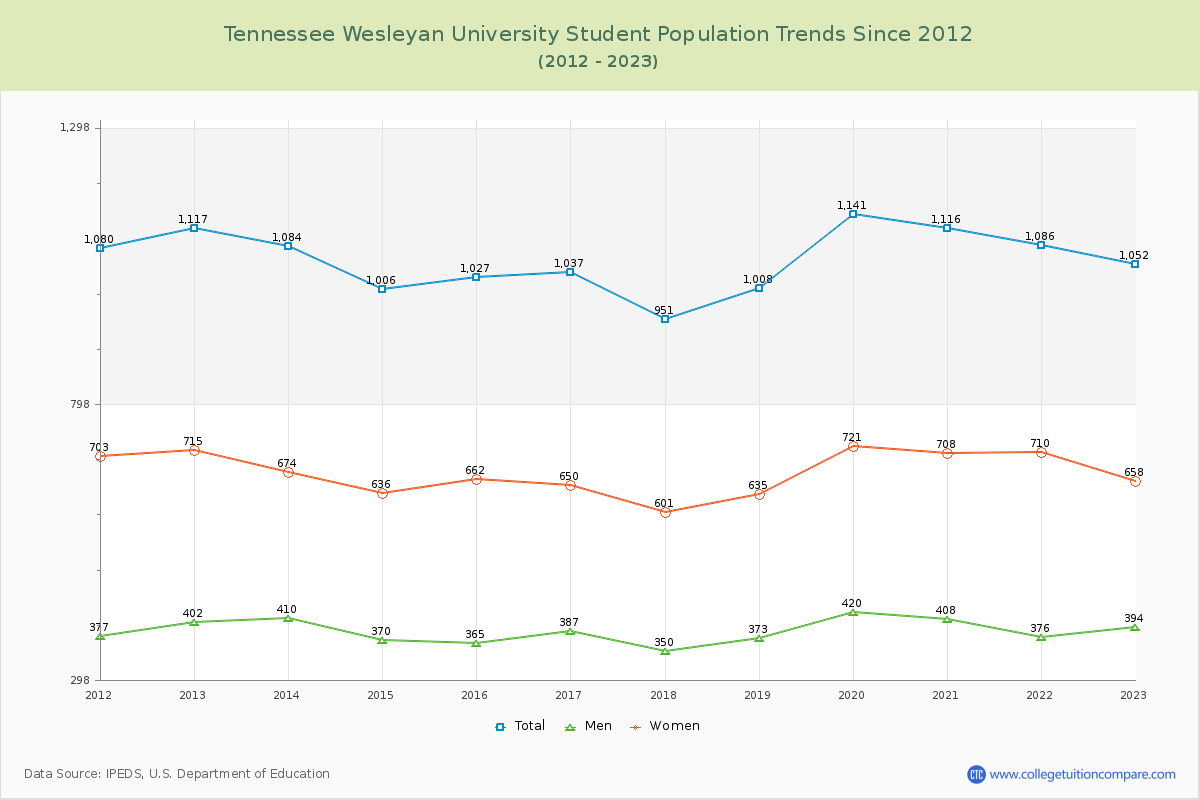
Student Population Changes
The average student population over the last 12 years is 1,057 where 1,052 students are attending the school for the academic year 2022-2023.
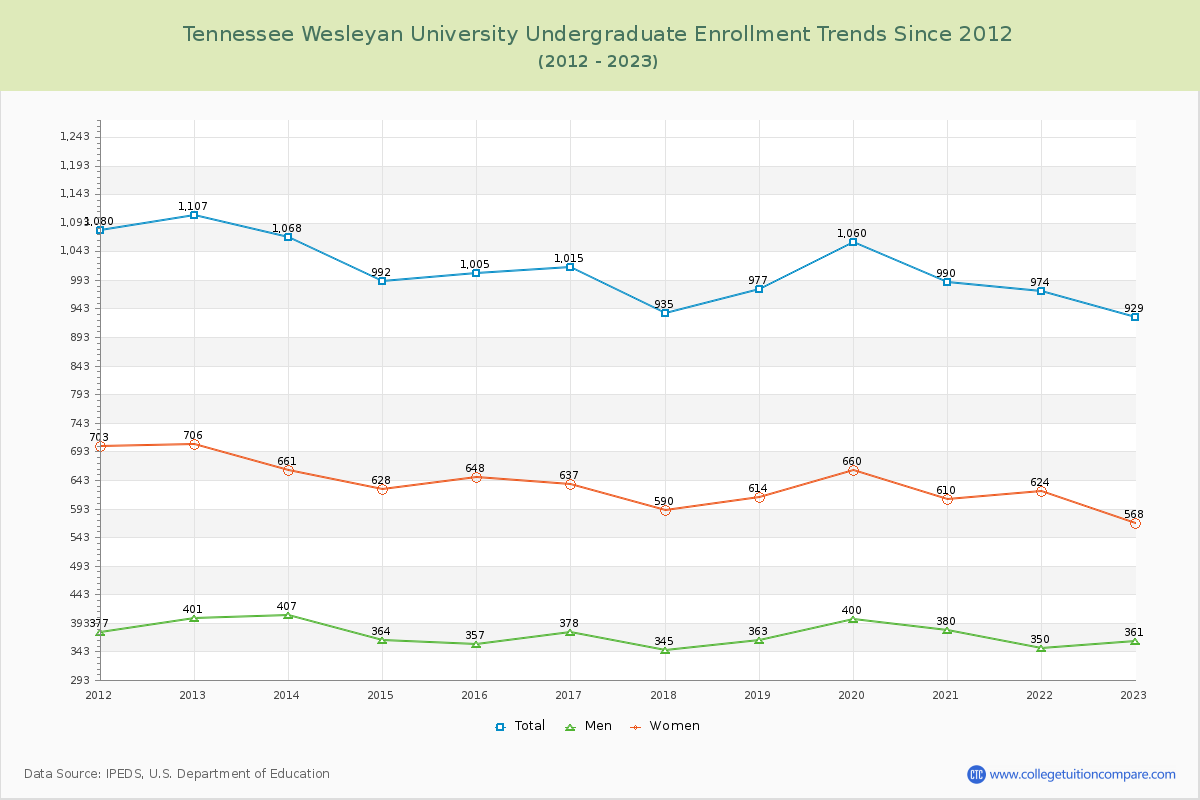
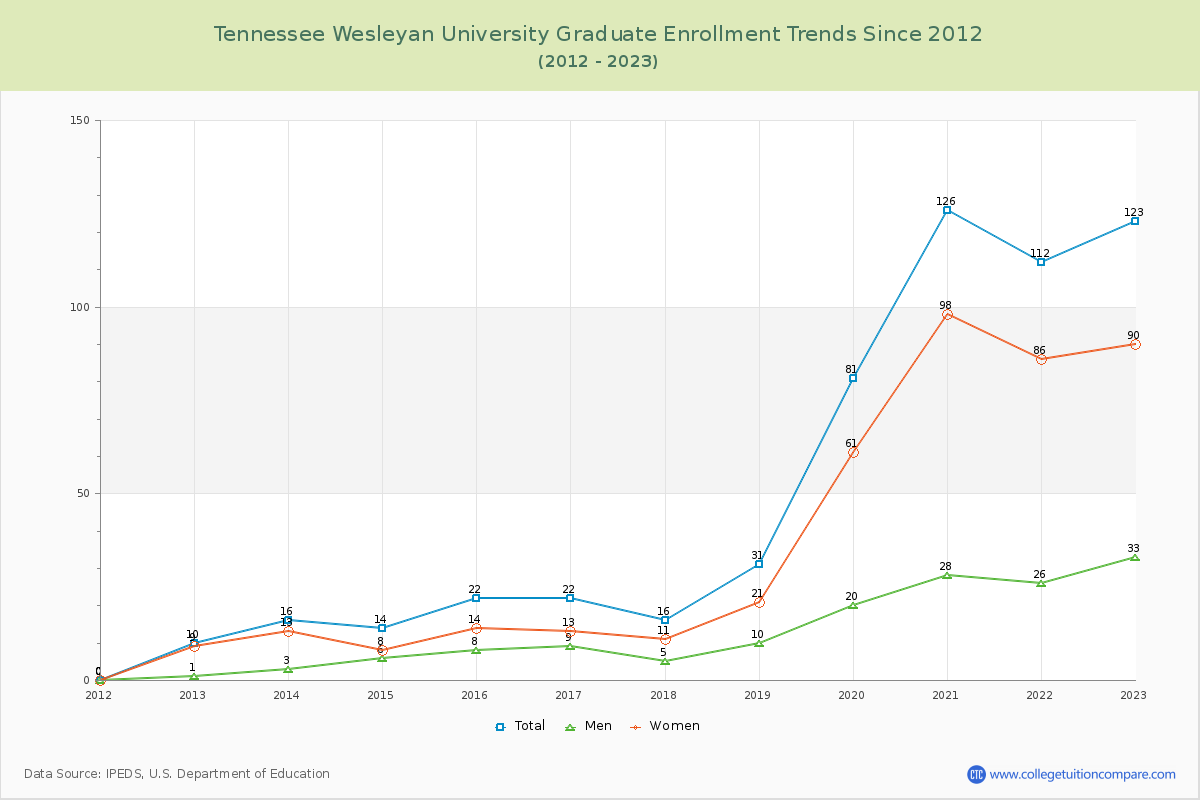
88.31% of total students is undergraduate students and 11.69% students is graduate students. The number of undergraduate students has decreased by 178 and the graduate enrollment has increased by 113 over past 10 years.
The female to male ratio is 1.67 to 1 and it means that there are more female students enrolled in Tennessee Wesleyan than male students.
The following table and chart illustrate the changes in student population by gender at Tennessee Wesleyan University since 2012.
| Year | Total | Undergraduate | Graduate | ||||
|---|---|---|---|---|---|---|---|
| Total | Men | Women | Total | Men | Women | ||
| 2012-13 | 1,117 | 1,107 | 401 | 706 | 10 | 1 | 9 |
| 2013-14 | 1,084 -33 | 1,068 -39 | 407 6 | 661 -45 | 16 6 | 3 2 | 13 4 |
| 2014-15 | 1,006 -78 | 992 -76 | 364 -43 | 628 -33 | 14 -2 | 6 3 | 8 -5 |
| 2015-16 | 1,027 21 | 1,005 13 | 357 -7 | 648 20 | 22 8 | 8 2 | 14 6 |
| 2016-17 | 1,037 10 | 1,015 10 | 378 21 | 637 -11 | 22 0 | 9 1 | 13 -1 |
| 2017-18 | 951 -86 | 935 -80 | 345 -33 | 590 -47 | 16 -6 | 5 -4 | 11 -2 |
| 2018-19 | 1,008 57 | 977 42 | 363 18 | 614 24 | 31 15 | 10 5 | 21 10 |
| 2019-20 | 1,141 133 | 1,060 83 | 400 37 | 660 46 | 81 50 | 20 10 | 61 40 |
| 2020-21 | 1,116 -25 | 990 -70 | 380 -20 | 610 -50 | 126 45 | 28 8 | 98 37 |
| 2021-22 | 1,086 -30 | 974 -16 | 350 -30 | 624 14 | 112 -14 | 26 -2 | 86 -12 |
| 2022-23 | 1,052 -34 | 929 -45 | 361 11 | 568 -56 | 123 11 | 33 7 | 90 4 |
| Average | 1,057 | 1,005 | 373 | 631 | 52 | 14 | 39 |